Caution
You're reading an old version of this documentation. If you want up-to-date information, please have a look at 0.11.0.
librosa.onset.onset_strength
- librosa.onset.onset_strength(*, y=None, sr=22050, S=None, lag=1, max_size=1, ref=None, detrend=False, center=True, feature=None, aggregate=None, **kwargs)[source]
Compute a spectral flux onset strength envelope.
Onset strength at time
tis determined by:mean_f max(0, S[f, t] - ref[f, t - lag])
where
refisSafter local max filtering along the frequency axis [1].By default, if a time series
yis provided, S will be the log-power Mel spectrogram.- Parameters:
- ynp.ndarray [shape=(…, n)]
audio time-series. Multi-channel is supported.
- srnumber > 0 [scalar]
sampling rate of
y- Snp.ndarray [shape=(…, d, m)]
pre-computed (log-power) spectrogram
- lagint > 0
time lag for computing differences
- max_sizeint > 0
size (in frequency bins) of the local max filter. set to 1 to disable filtering.
- refNone or np.ndarray [shape=(…, d, m)]
An optional pre-computed reference spectrum, of the same shape as
S. If not provided, it will be computed fromS. If provided, it will override any local max filtering governed bymax_size.- detrendbool [scalar]
Filter the onset strength to remove the DC component
- centerbool [scalar]
Shift the onset function by
n_fft // (2 * hop_length)frames. This corresponds to using a centered frame analysis in the short-time Fourier transform.- featurefunction
Function for computing time-series features, eg, scaled spectrograms. By default, uses
librosa.feature.melspectrogramwithfmax=sr/2- aggregatefunction
Aggregation function to use when combining onsets at different frequency bins.
Default:
np.mean- **kwargsadditional keyword arguments
Additional parameters to
feature(), ifSis not provided.
- Returns:
- onset_envelopenp.ndarray [shape=(…, m,)]
vector containing the onset strength envelope. If the input contains multiple channels, then onset envelope is computed for each channel.
- Raises:
- ParameterError
if neither
(y, sr)norSare providedor if
lagormax_sizeare not positive integers
See also
Examples
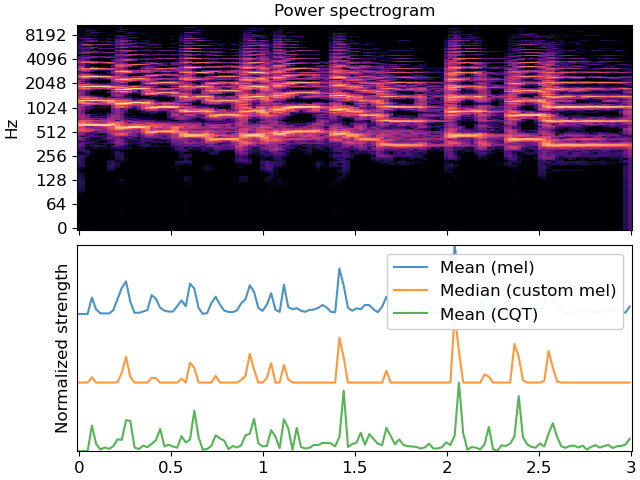
First, load some audio and plot the spectrogram
>>> import matplotlib.pyplot as plt
>>> y, sr = librosa.load(librosa.ex('trumpet'), duration=3)
>>> D = np.abs(librosa.stft(y))
>>> times = librosa.times_like(D)
>>> fig, ax = plt.subplots(nrows=2, sharex=True)
>>> librosa.display.specshow(librosa.amplitude_to_db(D, ref=np.max),
...                          y_axis='log', x_axis='time', ax=ax[0])
>>> ax[0].set(title='Power spectrogram')
>>> ax[0].label_outer()
Construct a standard onset function
>>> onset_env = librosa.onset.onset_strength(y=y, sr=sr)
>>> ax[1].plot(times, 2 + onset_env / onset_env.max(), alpha=0.8,
...            label='Mean (mel)')
Median aggregation, and custom mel options
>>> onset_env = librosa.onset.onset_strength(y=y, sr=sr,
...                                          aggregate=np.median,
...                                          fmax=8000, n_mels=256)
>>> ax[1].plot(times, 1 + onset_env / onset_env.max(), alpha=0.8,
...            label='Median (custom mel)')
Constant-Q spectrogram instead of Mel
>>> C = np.abs(librosa.cqt(y=y, sr=sr))
>>> onset_env = librosa.onset.onset_strength(sr=sr, S=librosa.amplitude_to_db(C, ref=np.max))
>>> ax[1].plot(times, onset_env / onset_env.max(), alpha=0.8,
...          label='Mean (CQT)')
>>> ax[1].legend()
>>> ax[1].set(ylabel='Normalized strength', yticks=[])