Caution
You're reading the documentation for a development version. For the latest released version, please have a look at 0.11.0.
librosa.display.ChromaFormatter
- class librosa.display.ChromaFormatter(key='C:maj', unicode=True)[source]
A formatter for chroma axes
- Parameters:
- keystr
The key in which to display pitch class labels. See
core.midi_to_notefor supported values.- unicodebool
If
True, use unicode symbols for accidentals.If
False, use ASCII symbols for accidentals.
See also
Examples
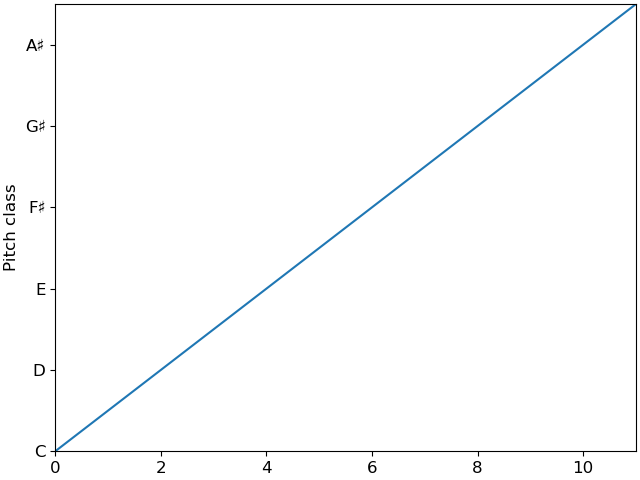
>>> import matplotlib.pyplot as plt
>>> values = np.arange(12)
>>> fig, ax = plt.subplots()
>>> ax.plot(values)
>>> ax.yaxis.set_major_formatter(librosa.display.ChromaFormatter())
>>> ax.set(ylabel='Pitch class')
Methods
__init__([key, unicode])create_dummy_axis(**kwargs)fix_minus(s)Some classes may want to replace a hyphen for minus with the proper Unicode symbol (U+2212) for typographical correctness. This is a helper method to perform such a replacement when it is enabled via :rc:`axes.unicode_minus`.
format_data(value)Return the context-independent string representation of a single value.
format_data_short(value)Return a short string representation of value for the mouseover tooltip (the coordinate display in the interactive figure window).
format_ticks(values)Return the tick label strings for all values.
get_offset()set_axis(axis)set_locs(locs)Set the locations of the ticks.
Attributes
axislocs[Deprecated]
keyunicode