Caution
You're reading the documentation for a development version. For the latest released version, please have a look at 0.11.0.
librosa.pyin
- librosa.pyin(y, *, fmin, fmax, sr=22050, frame_length=2048, win_length=<DEPRECATED parameter>, hop_length=None, n_thresholds=100, beta_parameters=(2, 18), boltzmann_parameter=2, resolution=0.1, max_transition_rate=35.92, switch_prob=0.01, no_trough_prob=0.01, fill_na=nan, center=True, pad_mode='constant')[source]
Fundamental frequency (F0) estimation using probabilistic YIN (pYIN).
pYIN [1] is a modificatin of the YIN algorithm [2] for fundamental frequency (F0) estimation. In the first step of pYIN, F0 candidates and their probabilities are computed using the YIN algorithm. In the second step, Viterbi decoding is used to estimate the most likely F0 sequence and voicing flags.
- Parameters:
- ynp.ndarray [shape=(…, n)]
audio time series. Multi-channel is supported.
- fminnumber > 0 [scalar]
minimum frequency in Hertz. The recommended minimum is
librosa.note_to_hz('C2')(~65 Hz) though lower values may be feasible.- fmaxnumber > fmin, <= sr/2 [scalar]
maximum frequency in Hertz. The recommended maximum is
librosa.note_to_hz('C7')(~2093 Hz) though higher values may be feasible.- srnumber > 0 [scalar]
sampling rate of
yin Hertz.- frame_lengthint > 0 [scalar]
length of the frames in samples. By default,
frame_length=2048corresponds to a time scale of about 93 ms at a sampling rate of 22050 Hz.- hop_lengthNone or int > 0 [scalar]
number of audio samples between adjacent pYIN predictions. If
None, defaults toframe_length // 4.- n_thresholdsint > 0 [scalar]
number of thresholds for peak estimation.
- beta_parameterstuple
shape parameters for the beta distribution prior over thresholds.
- boltzmann_parameternumber > 0 [scalar]
shape parameter for the Boltzmann distribution prior over troughs. Larger values will assign more mass to smaller periods.
- resolutionfloat in (0, 1)
Resolution of the pitch bins. 0.01 corresponds to cents.
- max_transition_ratefloat > 0
maximum pitch transition rate in octaves per second.
- switch_probfloat in
(0, 1) probability of switching from voiced to unvoiced or vice versa.
- no_trough_probfloat in
(0, 1) maximum probability to add to global minimum if no trough is below threshold.
- fill_naNone, float, or
np.nan default value for unvoiced frames of
f0. IfNone, the unvoiced frames will contain a best guess value.- centerboolean
If
True, the signalyis padded so that frameD[:, t]is centered aty[t * hop_length]. IfFalse, thenD[:, t]begins aty[t * hop_length]. Defaults toTrue, which simplifies the alignment ofDonto a time grid by means oflibrosa.core.frames_to_samples.- pad_modestring or function
If
center=True, this argument is passed tonp.padfor padding the edges of the signaly. By default (pad_mode="constant"),yis padded on both sides with zeros. Ifcenter=False, this argument is ignored. .. see also:: np.pad- win_lengthDeprecated
length of the window for calculating autocorrelation in samples.
Warning
This parameter is deprecated as of 0.11.0 and will be removed in 1.0.
- Returns:
- f0: np.ndarray [shape=(…, n_frames)]
time series of fundamental frequencies in Hertz.
- voiced_flag: np.ndarray [shape=(…, n_frames)]
time series containing boolean flags indicating whether a frame is voiced or not.
- voiced_prob: np.ndarray [shape=(…, n_frames)]
time series containing the probability that a frame is voiced.
Note
If multi-channel input is provided, f0 and voicing are estimated separately for each channel. ..
See also
librosa.yinFundamental frequency (F0) estimation using the YIN algorithm.
Examples
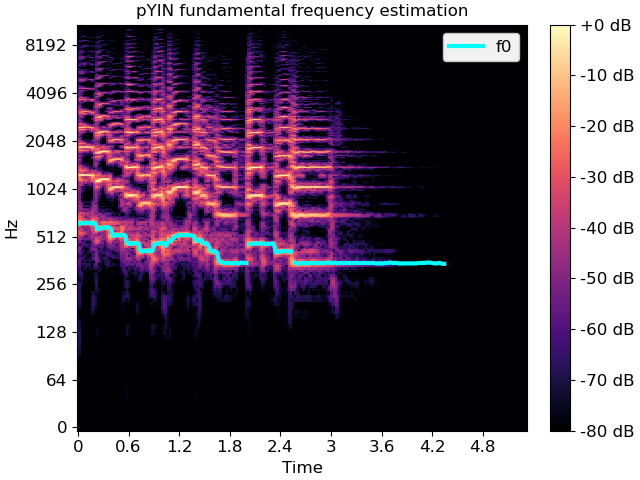
Computing a fundamental frequency (F0) curve from an audio input
>>> y, sr = librosa.load(librosa.ex('trumpet'))
>>> f0, voiced_flag, voiced_probs = librosa.pyin(y,
...                                              sr=sr,
...                                              fmin=librosa.note_to_hz('C2'),
...                                              fmax=librosa.note_to_hz('C7'))
>>> times = librosa.times_like(f0, sr=sr)
Overlay F0 over a spectrogram
>>> import matplotlib.pyplot as plt
>>> D = librosa.amplitude_to_db(np.abs(librosa.stft(y)), ref=np.max)
>>> fig, ax = plt.subplots()
>>> img = librosa.display.specshow(D, x_axis='time', y_axis='log', ax=ax)
>>> ax.set(title='pYIN fundamental frequency estimation')
>>> fig.colorbar(img, ax=ax, format="%+2.f dB")
>>> ax.plot(times, f0, label='f0', color='cyan', linewidth=3)
>>> ax.legend(loc='upper right')