Caution
You're reading an old version of this documentation. If you want up-to-date information, please have a look at 0.10.2.
librosa.feature.tempogram_ratio
- librosa.feature.tempogram_ratio(*, y=None, sr=22050, onset_envelope=None, tg=None, bpm=None, hop_length=512, win_length=384, start_bpm=120, std_bpm=1.0, max_tempo=320.0, freqs=None, factors=None, aggregate=None, prior=None, center=True, window='hann', kind='linear', fill_value=0, norm=inf)[source]
Tempogram ratio features, also known as spectral rhythm patterns. [1]
This function summarizes the energy at metrically important multiples of the tempo. For example, if the tempo corresponds to the quarter-note period, the tempogram ratio will measure the energy at the eighth note, sixteenth note, half note, whole note, etc. periods, as well as dotted and triplet ratios.
By default, the multiplicative factors used here are as specified by [2]. If the estimated tempo corresponds to a quarter note, these factors will measure relative energy at the following metrical subdivisions:
Index
Factor
Description
0
4
Sixteenth note
1
8/3
Dotted sixteenth
2
3
Eighth triplet
3
2
Eighth note
4
4/3
Dotted eighth
5
3/2
Quarter triplet
6
1
Quarter note
7
2/3
Dotted quarter
8
3/4
Half triplet
9
1/2
Half note
10
1/3
Dotted half note
11
3/8
Whole triplet
12
1/4
Whole note
[1]Peeters, Geoffroy. “Rhythm Classification Using Spectral Rhythm Patterns.” In ISMIR, pp. 644-647. 2005.
[2]Prockup, Matthew, Andreas F. Ehmann, Fabien Gouyon, Erik M. Schmidt, and Youngmoo E. Kim. “Modeling musical rhythm at scale with the music genome project.” In 2015 IEEE workshop on applications of signal processing to audio and acoustics (WASPAA), pp. 1-5. IEEE, 2015.
- Parameters:
- ynp.ndarray [shape=(…, n)] or None
audio time series
- srnumber > 0 [scalar]
sampling rate of the time series
- onset_envelopenp.ndarray [shape=(…, n)]
pre-computed onset strength envelope
- tgnp.ndarray
pre-computed tempogram. If provided, then y and onset_envelope are ignored, and win_length is inferred from the shape of the tempogram.
- bpmnp.ndarray
pre-computed tempo estimate. This must be a per-frame estimate, and have dimension compatible with tg.
- hop_lengthint > 0 [scalar]
hop length of the time series
- win_lengthint > 0 [scalar]
window length of the autocorrelation window for tempogram calculation
- start_bpmfloat [scalar]
initial guess of the BPM if bpm is not provided
- std_bpmfloat > 0 [scalar]
standard deviation of tempo distribution
- max_tempofloat > 0 [scalar, optional]
If provided, only estimate tempo below this threshold
- freqsnp.ndarray
Frequencies (in BPM) of the tempogram axis.
- factorsnp.ndarray
Multiples of the fundamental tempo (bpm) to estimate. If not provided, the factors are as specified above.
- priorscipy.stats.rv_continuous [optional]
A prior distribution over tempo (in beats per minute). By default, a pseudo-log-normal prior is used. If given,
start_bpmandstd_bpmwill be ignored.- centerbool
If True, onset windows are centered. If False, windows are left-aligned.
- aggregatecallable [optional]
Aggregation function for estimating global tempogram ratio. If None, then ratios are estimated independently for each frame.
- windowstring, function, number, tuple, or np.ndarray [shape=(win_length,)]
A window specification as in stft.
- kindstr
Interpolation mode for measuring tempogram ratios
- fill_valuefloat
The value to fill when extrapolating beyond the observed frequency range.
- norm{np.inf, -np.inf, 0, float > 0, None}
Normalization mode. Set to None to disable normalization.
- Returns:
- tgrnp.ndarray
The tempogram ratio for the specified factors. If aggregate is provided, the trailing time axis will be removed. If aggregate is not provided (default), ratios will be estimated for each frame.
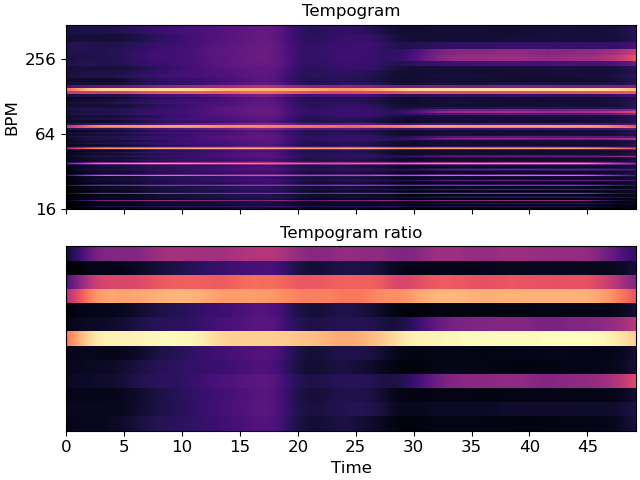
Examples
Compute tempogram ratio features using the default factors for a waltz (3/4 time)
>>> import matplotlib.pyplot as plt
>>> y, sr = librosa.load(librosa.ex('sweetwaltz'))
>>> tempogram = librosa.feature.tempogram(y=y, sr=sr)
>>> tgr = librosa.feature.tempogram_ratio(tg=tempogram, sr=sr)
>>> fig, ax = plt.subplots(nrows=2, sharex=True)
>>> librosa.display.specshow(tempogram, x_axis='time', y_axis='tempo',
...                          ax=ax[0])
>>> librosa.display.specshow(tgr, x_axis='time', ax=ax[1])
>>> ax[0].label_outer()
>>> ax[0].set(title="Tempogram")
>>> ax[1].set(title="Tempogram ratio")