Caution
You're reading an old version of this documentation. If you want up-to-date information, please have a look at 0.10.2.
librosa.onset.onset_backtrack
- librosa.onset.onset_backtrack(events, energy)[source]
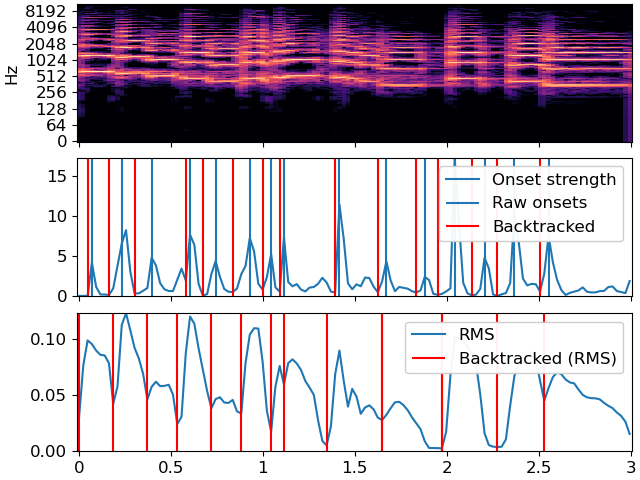
Backtrack detected onset events to the nearest preceding local minimum of an energy function.
This function can be used to roll back the timing of detected onsets from a detected peak amplitude to the preceding minimum.
This is most useful when using onsets to determine slice points for segmentation, as described by [1].
- Parameters:
- eventsnp.ndarray, dtype=int
List of onset event frame indices, as computed by
onset_detect- energynp.ndarray, shape=(m,)
An energy function
- Returns:
- events_backtrackednp.ndarray, shape=events.shape
The input events matched to nearest preceding minima of
energy.
Examples
Backtrack the events using the onset envelope
>>> y, sr = librosa.load(librosa.ex('trumpet'), duration=3)
>>> oenv = librosa.onset.onset_strength(y=y, sr=sr)
>>> times = librosa.times_like(oenv)
>>> # Detect events without backtracking
>>> onset_raw = librosa.onset.onset_detect(onset_envelope=oenv,
...                                        backtrack=False)
>>> onset_bt = librosa.onset.onset_backtrack(onset_raw, oenv)
Backtrack the events using the RMS values
>>> S = np.abs(librosa.stft(y=y))
>>> rms = librosa.feature.rms(S=S)
>>> onset_bt_rms = librosa.onset.onset_backtrack(onset_raw, rms[0])
Plot the results
>>> import matplotlib.pyplot as plt
>>> fig, ax = plt.subplots(nrows=3, sharex=True)
>>> librosa.display.specshow(librosa.amplitude_to_db(S, ref=np.max),
...                          y_axis='log', x_axis='time', ax=ax[0])
>>> ax[0].label_outer()
>>> ax[1].plot(times, oenv, label='Onset strength')
>>> ax[1].vlines(librosa.frames_to_time(onset_raw), 0, oenv.max(), label='Raw onsets')
>>> ax[1].vlines(librosa.frames_to_time(onset_bt), 0, oenv.max(), label='Backtracked', color='r')
>>> ax[1].legend()
>>> ax[1].label_outer()
>>> ax[2].plot(times, rms[0], label='RMS')
>>> ax[2].vlines(librosa.frames_to_time(onset_bt_rms), 0, rms.max(), label='Backtracked (RMS)', color='r')
>>> ax[2].legend()
