Caution
You're reading an old version of this documentation. If you want up-to-date information, please have a look at 0.10.2.
Note
Go to the end to download the full example code.
Superflux onsets
This notebook demonstrates how to recover the Superflux onset detection algorithm of Boeck and Widmer, 2013 from librosa.
This algorithm improves onset detection accuracy in the presence of vibrato.
# Code source: Brian McFee
# License: ISC
We’ll need numpy and matplotlib for this example
import numpy as np
import matplotlib.pyplot as plt

import librosa
import librosa.display
The method works fine for longer signals, but the results are harder to visualize.
y, sr = librosa.load(librosa.ex('trumpet', hq=True),
                     sr=44100)
These parameters are taken directly from the paper
n_fft = 1024
hop_length = int(librosa.time_to_samples(1./200, sr=sr))
lag = 2
n_mels = 138
fmin = 27.5
fmax = 16000.
max_size = 3
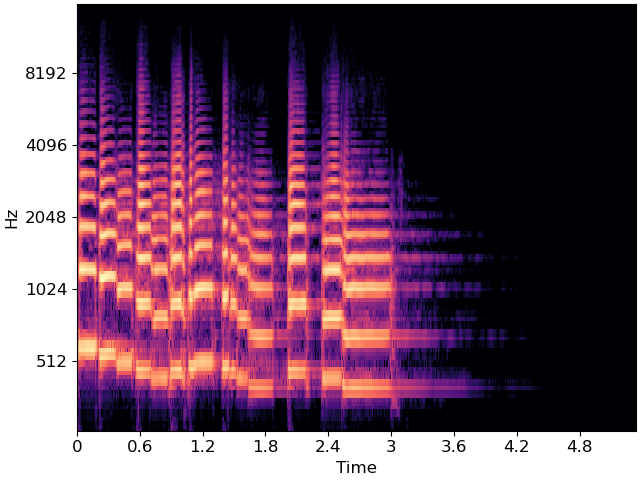
The paper uses a log-frequency representation, but for simplicity, we’ll use a Mel spectrogram instead.
S = librosa.feature.melspectrogram(y, sr=sr, n_fft=n_fft,
                                   hop_length=hop_length,
                                   fmin=fmin,
                                   fmax=fmax,
                                   n_mels=n_mels)


fig, ax = plt.subplots()
librosa.display.specshow(librosa.power_to_db(S, ref=np.max),
                         y_axis='mel', x_axis='time', sr=sr,
                         hop_length=hop_length, fmin=fmin, fmax=fmax, ax=ax)
Now we’ll compute the onset strength envelope and onset events using the librosa defaults.
odf_default = librosa.onset.onset_strength(y=y, sr=sr, hop_length=hop_length)
onset_default = librosa.onset.onset_detect(y=y, sr=sr, hop_length=hop_length,
                                           units='time')
And similarly with the superflux method
odf_sf = librosa.onset.onset_strength(S=librosa.power_to_db(S, ref=np.max),
                                      sr=sr,
                                      hop_length=hop_length,
                                      lag=lag, max_size=max_size)

onset_sf = librosa.onset.onset_detect(onset_envelope=odf_sf,
                                      sr=sr,
                                      hop_length=hop_length,
                                      units='time')
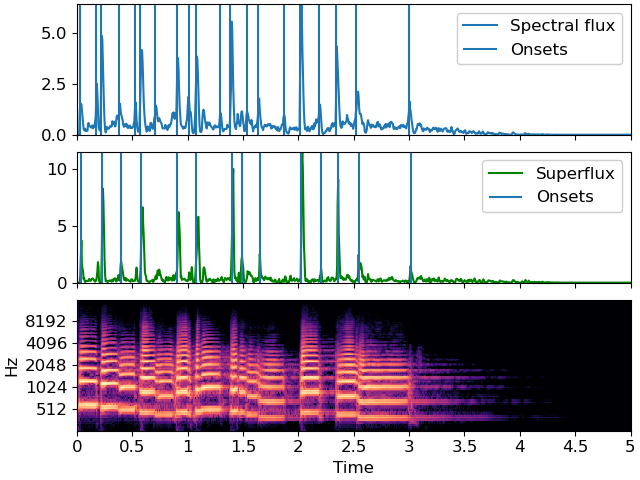
If you look carefully, the default onset detector (top sub-plot) has several false positives in high-vibrato regions, eg around 0.62s or 1.80s.
The superflux method (middle plot) is less susceptible to vibrato, and does not detect onset events at those points.
# sphinx_gallery_thumbnail_number = 2
fig, ax = plt.subplots(nrows=3, sharex=True)

frame_time = librosa.frames_to_time(np.arange(len(odf_default)),
                                    sr=sr,
                                    hop_length=hop_length)

librosa.display.specshow(librosa.power_to_db(S, ref=np.max),
                         y_axis='mel', x_axis='time', sr=sr,
                         hop_length=hop_length, fmin=fmin, fmax=fmax, ax=ax[2])
ax[2].set(xlim=[0, 5.0])


ax[0].plot(frame_time, odf_default, label='Spectral flux')
ax[0].vlines(onset_default, 0, odf_default.max(), label='Onsets')
ax[0].legend()
ax[0].label_outer()

ax[1].plot(frame_time, odf_sf, color='g', label='Superflux')
ax[1].vlines(onset_sf, 0, odf_sf.max(), label='Onsets')
ax[1].legend()
ax[0].label_outer()
Total running time of the script: (0 minutes 0.699 seconds)