Caution
You're reading an old version of this documentation. If you want up-to-date information, please have a look at 0.10.2.
librosa.util.peak_pick
- librosa.util.peak_pick(x, pre_max, post_max, pre_avg, post_avg, delta, wait)[source]
Uses a flexible heuristic to pick peaks in a signal.
A sample n is selected as an peak if the corresponding
x[n]fulfills the following three conditions:x[n] == max(x[n - pre_max:n + post_max])x[n] >= mean(x[n - pre_avg:n + post_avg]) + deltan - previous_n > wait
where
previous_nis the last sample picked as a peak (greedily).This implementation is based on [1] and [2].
- Parameters:
- xnp.ndarray [shape=(n,)]
input signal to peak picks from
- pre_maxint >= 0 [scalar]
number of samples before
nover which max is computed- post_maxint >= 1 [scalar]
number of samples after
nover which max is computed- pre_avgint >= 0 [scalar]
number of samples before
nover which mean is computed- post_avgint >= 1 [scalar]
number of samples after
nover which mean is computed- deltafloat >= 0 [scalar]
threshold offset for mean
- waitint >= 0 [scalar]
number of samples to wait after picking a peak
- Returns:
- peaksnp.ndarray [shape=(n_peaks,), dtype=int]
indices of peaks in
x
- Raises:
- ParameterError
If any input lies outside its defined range
Examples
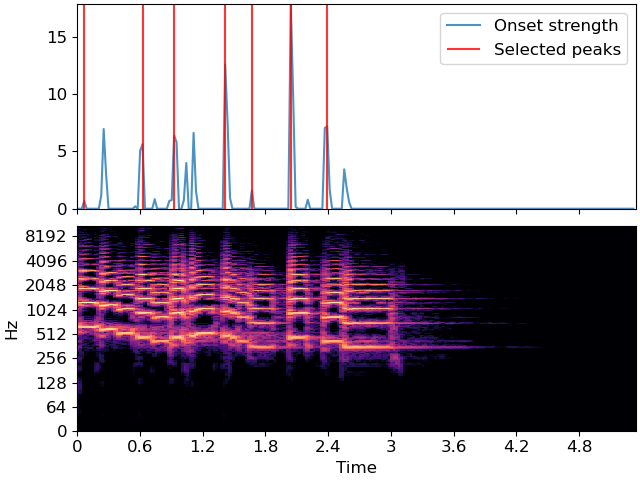
>>> y, sr = librosa.load(librosa.ex('trumpet'))
>>> onset_env = librosa.onset.onset_strength(y=y, sr=sr,
...                                          hop_length=512,
...                                          aggregate=np.median)
>>> peaks = librosa.util.peak_pick(onset_env, 3, 3, 3, 5, 0.5, 10)
>>> peaks
array([  3,  27,  40,  61,  72,  88, 103])
>>> import matplotlib.pyplot as plt
>>> times = librosa.times_like(onset_env, sr=sr, hop_length=512)
>>> fig, ax = plt.subplots(nrows=2, sharex=True)
>>> D = np.abs(librosa.stft(y))
>>> librosa.display.specshow(librosa.amplitude_to_db(D, ref=np.max),
...                          y_axis='log', x_axis='time', ax=ax[1])
>>> ax[0].plot(times, onset_env, alpha=0.8, label='Onset strength')
>>> ax[0].vlines(times[peaks], 0,
...              onset_env.max(), color='r', alpha=0.8,
...              label='Selected peaks')
>>> ax[0].legend(frameon=True, framealpha=0.8)
>>> ax[0].label_outer()