librosa.feature.mfcc#
- librosa.feature.mfcc(*, y=None, sr=22050, S=None, n_mfcc=20, dct_type=2, norm='ortho', lifter=0, mel_norm='slaney', ref=1.0, top_db=80.0, **kwargs)[source]#
Mel-frequency cepstral coefficients (MFCCs)
- Parameters:
- ynp.ndarray [shape=(…, n,)] or None
audio time series. Multi-channel is supported..
- srnumber > 0 [scalar]
sampling rate of
y- Snp.ndarray [shape=(…, d, t)] or None
log-power Mel spectrogram
- n_mfccint > 0 [scalar]
number of MFCCs to return
- dct_type{1, 2, 3}
Discrete cosine transform (DCT) type. By default, DCT type-2 is used.
- normNone or ‘ortho’
If
dct_typeis 2 or 3, settingnorm='ortho'uses an ortho-normal DCT basis. Normalization is not supported fordct_type=1.- lifternumber >= 0
- If
lifter>0, apply liftering (cepstral filtering) to the MFCCs:: M[n, :] <- M[n, :] * (1 + sin(pi * (n + 1) / lifter) * lifter / 2)
Setting
lifter >= 2 * n_mfccemphasizes the higher-order coefficients. Aslifterincreases, the coefficient weighting becomes approximately linear.- If
- mel_normfloat, ‘slaney’, or None
norm argument to
melspectrogram- reffloat or callable
Reference value for the log conversion, as in power_to_db. A scalar leaves each frame independent of the others. A callable such as np.max is evaluated over the frequency and time axes of each leading channel, which makes every frame’s output depend on every other frame in that channel.
This applies only when computing from
y; ifSis supplied it is assumed to already be in dB.- top_dbfloat or None
Threshold the mel spectrogram at
top_dbbelow its peak before the log conversion, as in power_to_db. The peak is computed over the frequency and time axes, independently for each leading channel, so a numeric value makes each frame’s output depend on every other frame in the same channel. PassNoneto disable the threshold and make the result depend only on the frame itself.- **kwargs
additional keyword arguments to
melspectrogramif operating on time series input- n_fftint > 0 [scalar]
length of the FFT frame
- hop_lengthint > 0 [scalar]
number of samples between successive frames. See
librosa.stft- win_lengthint <= n_fft [scalar]
Each frame of audio is windowed by window(). The window will be of length win_length and then padded with zeros to match
n_fft. If unspecified, defaults towin_length = n_fft.- windowstr, tuple, number, function, or np.ndarray [shape=(n_fft,)]
a window specification (str, tuple, or number); see
scipy.signal.get_windowa window function, such as
scipy.signal.windows.hanna vector or array of length
n_fft
- centerbool
If True, the signal
yis padded so that frametis centered aty[t * hop_length].If False, then frame
tbegins aty[t * hop_length]
- pad_modestr
If
center=True, the padding mode to use at the edges of the signal. By default, STFT uses zero padding.- powerfloat > 0 [scalar]
Exponent applied to the spectrum before calculating the melspectrogram when the input is a time signal, e.g. 1 for magnitude, 2 for power (default), etc.
- **kwargs
additional keyword arguments for Mel filter bank parameters
- n_melsint > 0 [scalar]
number of Mel bands to generate
- fminfloat >= 0 [scalar]
lowest frequency (in Hz)
- fmaxfloat >= 0 [scalar]
highest frequency (in Hz). If None, use
fmax = sr / 2.0- htkbool [scalar]
use HTK formula instead of Slaney
- dtypenp.dtype
The data type of the output basis. By default, uses 32-bit (single-precision) floating point.
- Returns:
- Mnp.ndarray [shape=(…, n_mfcc, t)]
MFCC sequence
See also
Examples
Generate mfccs from a time series
>>> y, sr = librosa.loadx('libri1')
>>> librosa.feature.mfcc(y=y, sr=sr)
array([[-565.919, -564.288, ..., -426.484, -434.668],
       [  10.305,   12.509, ...,   88.43 ,   90.12 ],
       ...,
       [   2.807,    2.068, ...,   -6.725,   -5.159],
       [   2.822,    2.244, ...,   -6.198,   -6.177]], dtype=float32)
Using a different hop length and HTK-style Mel frequencies
>>> librosa.feature.mfcc(y=y, sr=sr, hop_length=1024, htk=True)
array([[-5.471e+02, -5.464e+02, ..., -4.446e+02, -4.200e+02],
       [ 1.361e+01,  1.402e+01, ...,  9.764e+01,  9.869e+01],
       ...,
       [ 4.097e-01, -2.029e+00, ..., -1.051e+01, -1.130e+01],
       [-1.119e-01, -1.688e+00, ..., -3.442e+00, -4.687e+00]],
      dtype=float32)
Use a pre-computed log-power Mel spectrogram
>>> S = librosa.feature.melspectrogram(y=y, sr=sr, n_mels=128,
...                                    fmax=8000)
>>> librosa.feature.mfcc(S=librosa.power_to_db(S))
array([[-559.974, -558.449, ..., -411.96 , -420.458],
       [  11.018,   13.046, ...,   76.972,   80.888],
       ...,
       [   2.713,    2.379, ...,    1.464,   -2.835],
       [   2.712,    2.619, ...,    2.209,    0.648]], dtype=float32)
Get more components
>>> mfccs = librosa.feature.mfcc(y=y, sr=sr, n_mfcc=40)
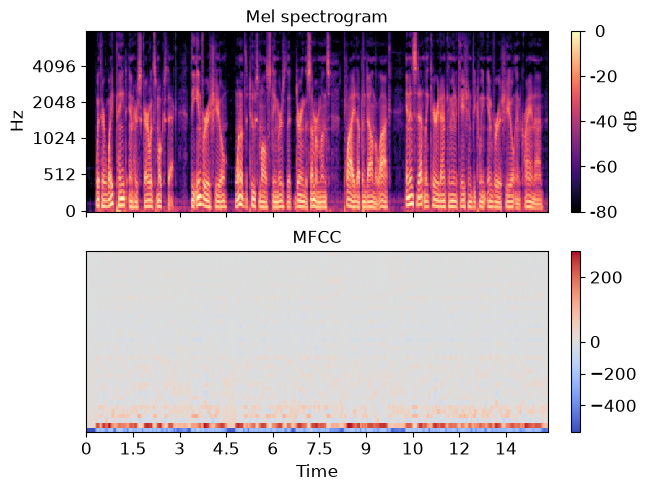
Visualize the MFCC series
>>> import matplotlib.pyplot as plt
>>> fig, ax = plt.subplots(nrows=2, sharex=True)
>>> img = librosa.display.specshow(S, vscale='dBFS[power]',
...                                x_axis='time', y_axis='mel', fmax=8000,
...                                ax=ax[0])
>>> librosa.display.colorbar_db(img)
>>> ax[0].set(title='Mel spectrogram')
>>> ax[0].label_outer()
>>> img = librosa.display.specshow(mfccs, x_axis='time', ax=ax[1])
>>> fig.colorbar(img, ax=[ax[1]])
>>> ax[1].set(title='MFCC')
>>> plt.show()
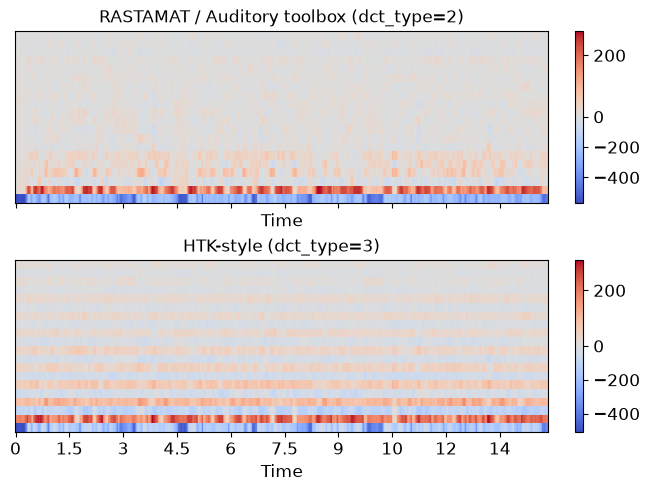
Compare different DCT bases
>>> m_slaney = librosa.feature.mfcc(y=y, sr=sr, dct_type=2)
>>> m_htk = librosa.feature.mfcc(y=y, sr=sr, dct_type=3)
>>> fig, ax = plt.subplots(nrows=2, sharex=True, sharey=True, layout='compressed')
>>> img1 = librosa.display.specshow(m_slaney, x_axis='time', ax=ax[0])
>>> ax[0].set(title='RASTAMAT / Auditory toolbox (dct_type=2)')
>>> fig.colorbar(img, ax=[ax[0]])
>>> img2 = librosa.display.specshow(m_htk, x_axis='time', ax=ax[1])
>>> ax[1].set(title='HTK-style (dct_type=3)')
>>> fig.colorbar(img2, ax=[ax[1]])
>>> plt.show()