
librosa.power_to_db#
- librosa.power_to_db(S, *, ref=1.0, amin=1e-10, top_db=80.0, axes='auto')[source]#
Convert a power spectrogram (amplitude squared) to decibel (dB) units
This computes the scaling
10 * log10(S / ref)in a numerically stable way.- Parameters:
- Snp.ndarray
input power
- refscalar or callable
If scalar, the amplitude
abs(S)is scaled relative toref:10 * log10(S / ref)
Zeros in the output correspond to positions where
S == ref.If callable, the reference value is computed as
ref(S, axis=axes, keepdims=True).- aminfloat > 0 [scalar]
minimum threshold for
abs(S)andref- top_dbfloat >= 0 [scalar]
threshold the output at
top_dbbelow the peak:max(10 * log10(S/ref)) - top_dbFor multi-channel inputs, with axes=’auto’, peaks are calculated independently for each channel.- axesNone, “auto”, int, or tuple of int
Axis or axes along which to compute the reference value (if ref is callable). If auto, then axes will be inferred as the trailing dimensions of S:
If S is scalar, then axes=None
If S is 1D, then axes=(-1,)
If S is >=2D, then axes=(-2, -1)
- Returns:
- S_dbnp.ndarray
S_db ~= 10 * log10(S) - 10 * log10(ref)
Notes
This function caches at level 30.
Examples
Get a power spectrogram from a waveform
y>>> y, sr = librosa.loadx('trumpet') >>> S = np.abs(librosa.stft(y)) >>> librosa.power_to_db(S**2) array([[-41.809, -41.809, ..., -41.809, -41.809], [-41.809, -41.809, ..., -41.809, -41.809], ..., [-41.809, -41.809, ..., -41.809, -41.809], [-41.809, -41.809, ..., -41.809, -41.809]], dtype=float32)
Compute dB relative to peak power
>>> librosa.power_to_db(S**2, ref=np.max)
array([[-80., -80., ..., -80., -80.],
       [-80., -80., ..., -80., -80.],
       ...,
       [-80., -80., ..., -80., -80.],
       [-80., -80., ..., -80., -80.]], dtype=float32)
Or compare to median power
>>> librosa.power_to_db(S**2, ref=np.median)
array([[16.578, 16.578, ..., 16.578, 16.578],
       [16.578, 16.578, ..., 16.578, 16.578],
       ...,
       [16.578, 16.578, ..., 16.578, 16.578],
       [16.578, 16.578, ..., 16.578, 16.578]], dtype=float32)
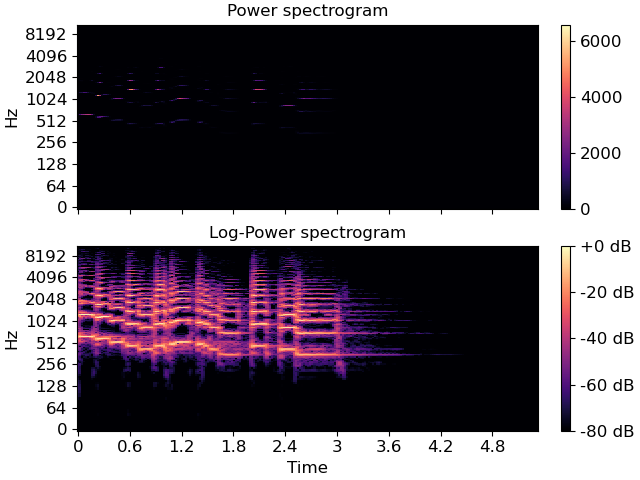
And plot the results
>>> import matplotlib.pyplot as plt
>>> fig, ax = plt.subplots(nrows=2, sharex=True, sharey=True)
>>> imgpow = librosa.display.specshow(S**2, sr=sr, y_axis='log', x_axis='time',
...                                   ax=ax[0])
>>> ax[0].set(title='Power spectrogram')
>>> ax[0].label_outer()
>>> imgdb = librosa.display.specshow(librosa.power_to_db(S**2, ref=np.max),
...                                  sr=sr, y_axis='log', x_axis='time', ax=ax[1])
>>> ax[1].set(title='Log-Power spectrogram')
>>> fig.colorbar(imgpow, ax=ax[0])
>>> librosa.display.colorbar_db(imgdb, ax=ax[1])