Caution
You're reading an old version of this documentation. If you want up-to-date information, please have a look at 0.9.1.
librosa.effects.preemphasis
- librosa.effects.preemphasis(y, coef=0.97, zi=None, return_zf=False)[source]
Pre-emphasize an audio signal with a first-order auto-regressive filter:
y[n] -> y[n] - coef * y[n-1]
- Parameters
- ynp.ndarray
Audio signal
- coefpositive number
Pre-emphasis coefficient. Typical values of coef are between 0 and 1.
At the limit coef=0, the signal is unchanged.
At coef=1, the result is the first-order difference of the signal.
- zinumber
Initial filter state
- return_zfboolean
If True, return the final filter state. If False, only return the pre-emphasized signal.
- Returns
- `y_out`np.ndarray
pre-emphasized signal
- zfnumber
if return_zf=True, the final filter state is also returned
Examples
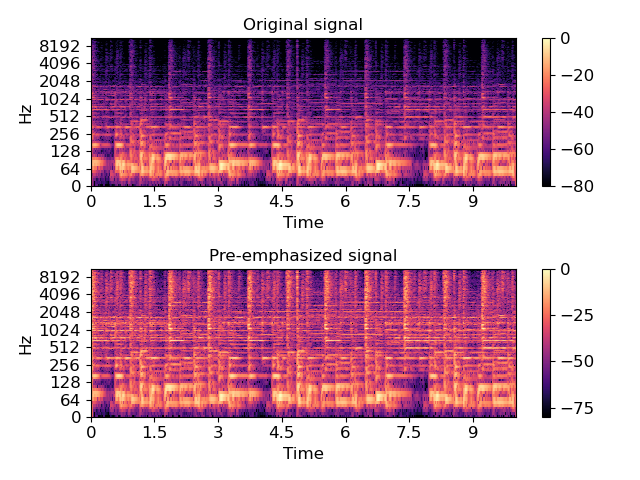
Apply a standard pre-emphasis filter
>>> import matplotlib.pyplot as plt
>>> y, sr = librosa.load(librosa.util.example_audio_file(), offset=30, duration=10)
>>> y_filt = librosa.effects.preemphasis(y)
>>> # and plot the results for comparison
>>> S_orig = librosa.amplitude_to_db(np.abs(librosa.stft(y)), ref=np.max)
>>> S_preemph = librosa.amplitude_to_db(np.abs(librosa.stft(y_filt)), ref=np.max)
>>> plt.subplot(2,1,1)
>>> librosa.display.specshow(S_orig, y_axis='log', x_axis='time')
>>> plt.title('Original signal')
>>> plt.colorbar()
>>> plt.subplot(2,1,2)
>>> librosa.display.specshow(S_preemph, y_axis='log', x_axis='time')
>>> plt.title('Pre-emphasized signal')
>>> plt.colorbar()
>>> plt.tight_layout();
Apply pre-emphasis in pieces for block streaming. Note that the second block initializes zi with the final state zf returned by the first call.
>>> y_filt_1, zf = librosa.effects.preemphasis(y[:1000], return_zf=True)
>>> y_filt_2, zf = librosa.effects.preemphasis(y[1000:], zi=zf, return_zf=True)
>>> np.allclose(y_filt, np.concatenate([y_filt_1, y_filt_2]))
True