Caution
You're reading an old version of this documentation. If you want up-to-date information, please have a look at 0.9.1.
librosa.onset.onset_detect
- librosa.onset.onset_detect(y=None, sr=22050, onset_envelope=None, hop_length=512, backtrack=False, energy=None, units='frames', **kwargs)[source]
Basic onset detector. Locate note onset events by picking peaks in an onset strength envelope.
The peak_pick parameters were chosen by large-scale hyper-parameter optimization over the dataset provided by [1].
- Parameters
- ynp.ndarray [shape=(n,)]
audio time series
- srnumber > 0 [scalar]
sampling rate of y
- onset_envelopenp.ndarray [shape=(m,)]
(optional) pre-computed onset strength envelope
- hop_lengthint > 0 [scalar]
hop length (in samples)
- units{‘frames’, ‘samples’, ‘time’}
The units to encode detected onset events in. By default, ‘frames’ are used.
- backtrackbool
If True, detected onset events are backtracked to the nearest preceding minimum of energy.
This is primarily useful when using onsets as slice points for segmentation.
- energynp.ndarray [shape=(m,)] (optional)
An energy function to use for backtracking detected onset events. If none is provided, then onset_envelope is used.
- kwargsadditional keyword arguments
Additional parameters for peak picking.
See
librosa.util.peak_pickfor details.
- Returns
- onsetsnp.ndarray [shape=(n_onsets,)]
estimated positions of detected onsets, in whichever units are specified. By default, frame indices.
Note
If no onset strength could be detected, onset_detect returns an empty list.
- Raises
- ParameterError
if neither y nor onsets are provided
or if units is not one of ‘frames’, ‘samples’, or ‘time’
See also
onset_strengthcompute onset strength per-frame
onset_backtrackbacktracking onset events
librosa.util.peak_pickpick peaks from a time series
Examples
Get onset times from a signal
>>> y, sr = librosa.load(librosa.util.example_audio_file(),
...                      offset=30, duration=2.0)
>>> onset_frames = librosa.onset.onset_detect(y=y, sr=sr)
>>> librosa.frames_to_time(onset_frames, sr=sr)
array([ 0.07 ,  0.395,  0.511,  0.627,  0.766,  0.975,
        1.207,  1.324,  1.44 ,  1.788,  1.881])
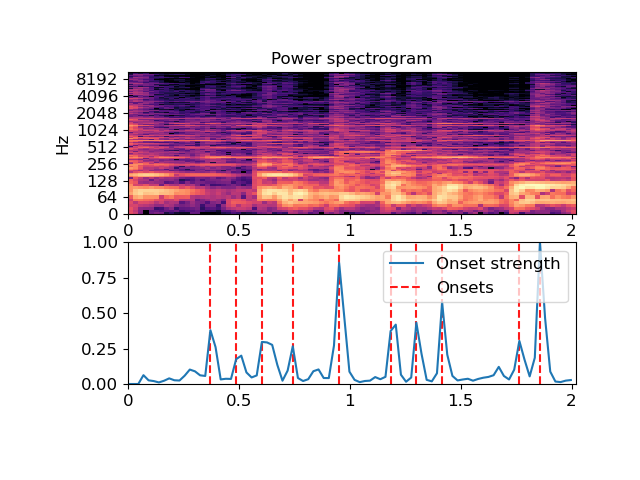
Or use a pre-computed onset envelope
>>> o_env = librosa.onset.onset_strength(y, sr=sr)
>>> times = librosa.times_like(o_env, sr=sr)
>>> onset_frames = librosa.onset.onset_detect(onset_envelope=o_env, sr=sr)
>>> import matplotlib.pyplot as plt
>>> D = np.abs(librosa.stft(y))
>>> plt.figure()
>>> ax1 = plt.subplot(2, 1, 1)
>>> librosa.display.specshow(librosa.amplitude_to_db(D, ref=np.max),
...                          x_axis='time', y_axis='log')
>>> plt.title('Power spectrogram')
>>> plt.subplot(2, 1, 2, sharex=ax1)
>>> plt.plot(times, o_env, label='Onset strength')
>>> plt.vlines(times[onset_frames], 0, o_env.max(), color='r', alpha=0.9,
...            linestyle='--', label='Onsets')
>>> plt.axis('tight')
>>> plt.legend(frameon=True, framealpha=0.75)
>>> plt.show()