Caution
You're reading an old version of this documentation. If you want up-to-date information, please have a look at 0.9.1.
librosa.util.nnls
- librosa.util.nnls(A, B, **kwargs)[source]
Non-negative least squares.
Given two matrices A and B, find a non-negative matrix X that minimizes the sum squared error:
err(X) = sum_i,j ((AX)[i,j] - B[i, j])^2
- Parameters
- Anp.ndarray [shape=(m, n)]
The basis matrix
- Bnp.ndarray [shape=(m, N)]
The target matrix.
- kwargs
Additional keyword arguments to
scipy.optimize.fmin_l_bfgs_b
- Returns
- Xnp.ndarray [shape=(n, N), non-negative]
A minimizing solution to |AX - B|^2
Examples
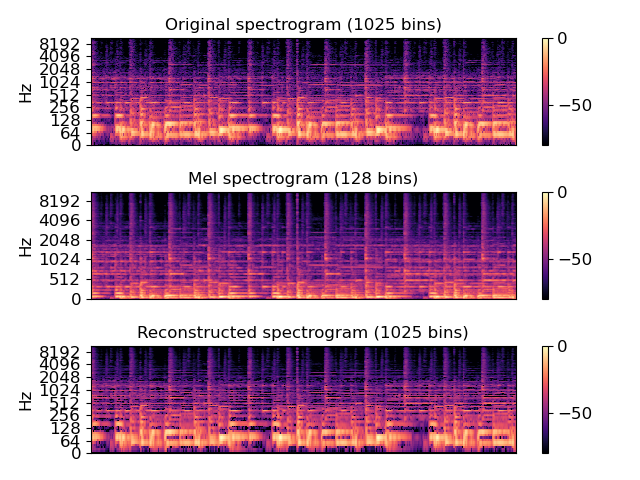
Approximate a magnitude spectrum from its mel spectrogram
>>> y, sr = librosa.load(librosa.util.example_audio_file(), offset=30, duration=10)
>>> S = np.abs(librosa.stft(y, n_fft=2048))
>>> M = librosa.feature.melspectrogram(S=S, sr=sr, power=1)
>>> mel_basis = librosa.filters.mel(sr, n_fft=2048, n_mels=M.shape[0])
>>> S_recover = librosa.util.nnls(mel_basis, M)
Plot the results
>>> import matplotlib.pyplot as plt
>>> plt.figure()
>>> plt.subplot(3,1,1)
>>> librosa.display.specshow(librosa.amplitude_to_db(S, ref=np.max), y_axis='log')
>>> plt.colorbar()
>>> plt.title('Original spectrogram (1025 bins)')
>>> plt.subplot(3,1,2)
>>> librosa.display.specshow(librosa.amplitude_to_db(M, ref=np.max),
...                          y_axis='mel')
>>> plt.title('Mel spectrogram (128 bins)')
>>> plt.colorbar()
>>> plt.subplot(3,1,3)
>>> librosa.display.specshow(librosa.amplitude_to_db(S_recover, ref=np.max),
...                          y_axis='log')
>>> plt.colorbar()
>>> plt.title('Reconstructed spectrogram (1025 bins)')
>>> plt.tight_layout()
>>> plt.show()