Caution
You're reading an old version of this documentation. If you want up-to-date information, please have a look at 0.9.1.
librosa.util.sync
- librosa.util.sync(data, idx, aggregate=None, pad=True, axis=- 1)[source]
Synchronous aggregation of a multi-dimensional array between boundaries
Note
In order to ensure total coverage, boundary points may be added to idx.
If synchronizing a feature matrix against beat tracker output, ensure that frame index numbers are properly aligned and use the same hop length.
- Parameters
- datanp.ndarray
multi-dimensional array of features
- idxiterable of ints or slices
Either an ordered array of boundary indices, or an iterable collection of slice objects.
- aggregatefunction
aggregation function (default: np.mean)
- padboolean
If True, idx is padded to span the full range [0, data.shape[axis]]
- axisint
The axis along which to aggregate data
- Returns
- data_syncndarray
data_sync will have the same dimension as data, except that the axis coordinate will be reduced according to idx.
For example, a 2-dimensional data with axis=-1 should satisfy
data_sync[:, i] = aggregate(data[:, idx[i-1]:idx[i]], axis=-1)
- Raises
- ParameterError
If the index set is not of consistent type (all slices or all integers)
Notes
This function caches at level 40.
Examples
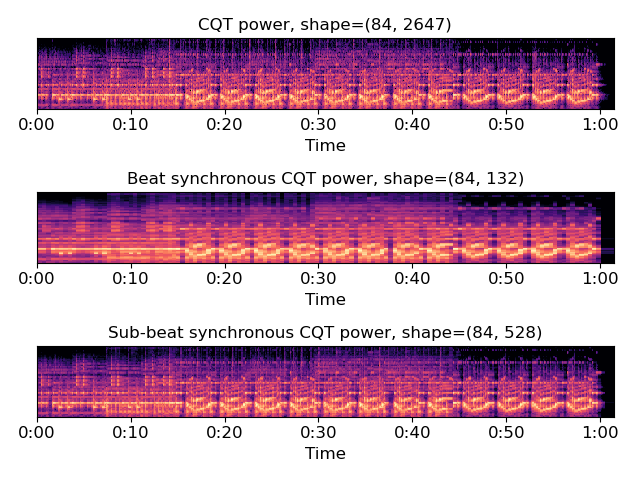
Beat-synchronous CQT spectra
>>> y, sr = librosa.load(librosa.util.example_audio_file())
>>> tempo, beats = librosa.beat.beat_track(y=y, sr=sr, trim=False)
>>> C = np.abs(librosa.cqt(y=y, sr=sr))
>>> beats = librosa.util.fix_frames(beats, x_max=C.shape[1])
By default, use mean aggregation
>>> C_avg = librosa.util.sync(C, beats)
Use median-aggregation instead of mean
>>> C_med = librosa.util.sync(C, beats,
...                             aggregate=np.median)
Or sub-beat synchronization
>>> sub_beats = librosa.segment.subsegment(C, beats)
>>> sub_beats = librosa.util.fix_frames(sub_beats, x_max=C.shape[1])
>>> C_med_sub = librosa.util.sync(C, sub_beats, aggregate=np.median)
Plot the results
>>> import matplotlib.pyplot as plt
>>> beat_t = librosa.frames_to_time(beats, sr=sr)
>>> subbeat_t = librosa.frames_to_time(sub_beats, sr=sr)
>>> plt.figure()
>>> plt.subplot(3, 1, 1)
>>> librosa.display.specshow(librosa.amplitude_to_db(C,
...                                                  ref=np.max),
...                          x_axis='time')
>>> plt.title('CQT power, shape={}'.format(C.shape))
>>> plt.subplot(3, 1, 2)
>>> librosa.display.specshow(librosa.amplitude_to_db(C_med,
...                                                  ref=np.max),
...                          x_coords=beat_t, x_axis='time')
>>> plt.title('Beat synchronous CQT power, '
...           'shape={}'.format(C_med.shape))
>>> plt.subplot(3, 1, 3)
>>> librosa.display.specshow(librosa.amplitude_to_db(C_med_sub,
...                                                  ref=np.max),
...                          x_coords=subbeat_t, x_axis='time')
>>> plt.title('Sub-beat synchronous CQT power, '
...           'shape={}'.format(C_med_sub.shape))
>>> plt.tight_layout()
>>> plt.show()