Caution
You're reading an old version of this documentation. If you want up-to-date information, please have a look at 0.9.1.
librosa.beat.beat_track
- librosa.beat.beat_track(*, y=None, sr=22050, onset_envelope=None, hop_length=512, start_bpm=120.0, tightness=100, trim=True, bpm=None, prior=None, units='frames')[source]
Dynamic programming beat tracker.
Beats are detected in three stages, following the method of 1:
Measure onset strength
Estimate tempo from onset correlation
Pick peaks in onset strength approximately consistent with estimated tempo
- 1
Ellis, Daniel PW. “Beat tracking by dynamic programming.” Journal of New Music Research 36.1 (2007): 51-60. http://labrosa.ee.columbia.edu/projects/beattrack/
- Parameters
- ynp.ndarray [shape=(n,)] or None
audio time series
- srnumber > 0 [scalar]
sampling rate of
y- onset_envelopenp.ndarray [shape=(n,)] or None
(optional) pre-computed onset strength envelope.
- hop_lengthint > 0 [scalar]
number of audio samples between successive
onset_envelopevalues- start_bpmfloat > 0 [scalar]
initial guess for the tempo estimator (in beats per minute)
- tightnessfloat [scalar]
tightness of beat distribution around tempo
- trimbool [scalar]
trim leading/trailing beats with weak onsets
- bpmfloat [scalar]
(optional) If provided, use
bpmas the tempo instead of estimating it fromonsets.- priorscipy.stats.rv_continuous [optional]
An optional prior distribution over tempo. If provided,
start_bpmwill be ignored.- units{‘frames’, ‘samples’, ‘time’}
The units to encode detected beat events in. By default, ‘frames’ are used.
- Returns
- tempofloat [scalar, non-negative]
estimated global tempo (in beats per minute)
- beatsnp.ndarray [shape=(m,)]
estimated beat event locations in the specified units (default is frame indices)
Note
If no onset strength could be detected, beat_tracker estimates 0 BPM and returns an empty list.
- Raises
- ParameterError
if neither
ynoronset_envelopeare provided, or ifunitsis not one of ‘frames’, ‘samples’, or ‘time’
See also
Examples
Track beats using time series input
>>> y, sr = librosa.load(librosa.ex('choice'), duration=10)
>>> tempo, beats = librosa.beat.beat_track(y=y, sr=sr)
>>> tempo
135.99917763157896
Print the frames corresponding to beats
>>> beats
array([  3,  21,  40,  59,  78,  96, 116, 135, 154, 173, 192, 211,
       230, 249, 268, 287, 306, 325, 344, 363])
Or print them as timestamps
>>> librosa.frames_to_time(beats, sr=sr)
array([0.07 , 0.488, 0.929, 1.37 , 1.811, 2.229, 2.694, 3.135,
       3.576, 4.017, 4.458, 4.899, 5.341, 5.782, 6.223, 6.664,
       7.105, 7.546, 7.988, 8.429])
Track beats using a pre-computed onset envelope
>>> onset_env = librosa.onset.onset_strength(y=y, sr=sr,
...                                          aggregate=np.median)
>>> tempo, beats = librosa.beat.beat_track(onset_envelope=onset_env,
...                                        sr=sr)
>>> tempo
135.99917763157896
>>> beats
array([  3,  21,  40,  59,  78,  96, 116, 135, 154, 173, 192, 211,
       230, 249, 268, 287, 306, 325, 344, 363])
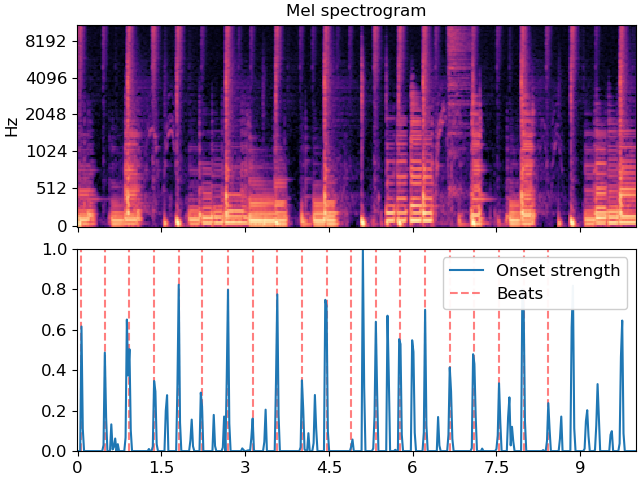
Plot the beat events against the onset strength envelope
>>> import matplotlib.pyplot as plt
>>> hop_length = 512
>>> fig, ax = plt.subplots(nrows=2, sharex=True)
>>> times = librosa.times_like(onset_env, sr=sr, hop_length=hop_length)
>>> M = librosa.feature.melspectrogram(y=y, sr=sr, hop_length=hop_length)
>>> librosa.display.specshow(librosa.power_to_db(M, ref=np.max),
...                          y_axis='mel', x_axis='time', hop_length=hop_length,
...                          ax=ax[0])
>>> ax[0].label_outer()
>>> ax[0].set(title='Mel spectrogram')
>>> ax[1].plot(times, librosa.util.normalize(onset_env),
...          label='Onset strength')
>>> ax[1].vlines(times[beats], 0, 1, alpha=0.5, color='r',
...            linestyle='--', label='Beats')
>>> ax[1].legend()
