librosa.filters.semitone_filterbank
- librosa.filters.semitone_filterbank(*, center_freqs=None, tuning=0.0, sample_rates=None, flayout='ba', **kwargs)[source]
Construct a multi-rate bank of infinite-impulse response (IIR) band-pass filters at user-defined center frequencies and sample rates.
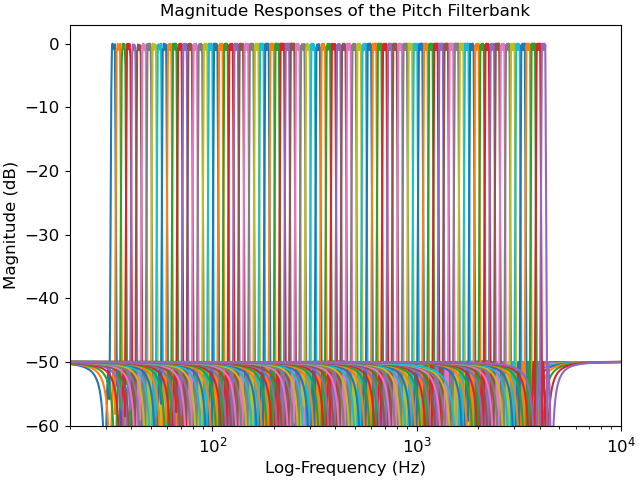
By default, these center frequencies are set equal to the 88 fundamental frequencies of the grand piano keyboard, according to a pitch tuning standard of A440, that is, note A above middle C set to 440 Hz. The center frequencies are tuned to the twelve-tone equal temperament, which means that they grow exponentially at a rate of 2**(1/12), that is, twelve notes per octave.
The A440 tuning can be changed by the user while keeping twelve-tone equal temperament. While A440 is currently the international standard in the music industry (ISO 16), some orchestras tune to A441-A445, whereas baroque musicians tune to A415.
See 1 for details.
- 1
Müller, Meinard. “Information Retrieval for Music and Motion.” Springer Verlag. 2007.
- Parameters
- center_freqsnp.ndarray [shape=(n,), dtype=float]
Center frequencies of the filter kernels. Also defines the number of filters in the filterbank.
- tuningfloat [scalar]
Tuning deviation from A440 as a fraction of a semitone (1/12 of an octave in equal temperament).
- sample_ratesnp.ndarray [shape=(n,), dtype=float]
Sample rates of each filter in the multirate filterbank.
- flayoutstring
If ba, the standard difference equation is used for filtering with
scipy.signal.filtfilt. Can be unstable for high-order filters.If sos, a series of second-order filters is used for filtering with
scipy.signal.sosfiltfilt. Minimizes numerical precision errors for high-order filters, but is slower.
- **kwargsadditional keyword arguments
Additional arguments to the private function _multirate_fb().
- Returns
- filterbanklist [shape=(n,), dtype=float]
Each list entry contains the filter coefficients for a single filter.
- fb_sample_ratesnp.ndarray [shape=(n,), dtype=float]
Sample rate for each filter.
Examples
>>> import matplotlib.pyplot as plt
>>> import numpy as np
>>> import scipy.signal
>>> semitone_filterbank, sample_rates = librosa.filters.semitone_filterbank()
>>> fig, ax = plt.subplots()
>>> for cur_sr, cur_filter in zip(sample_rates, semitone_filterbank):
...    w, h = scipy.signal.freqz(cur_filter[0], cur_filter[1], worN=2000)
...    ax.semilogx((cur_sr / (2 * np.pi)) * w, 20 * np.log10(abs(h)))
>>> ax.set(xlim=[20, 10e3], ylim=[-60, 3], title='Magnitude Responses of the Pitch Filterbank',
...        xlabel='Log-Frequency (Hz)', ylabel='Magnitude (dB)')
