Caution
You're reading the documentation for a development version. For the latest released version, please have a look at 0.11.0.
librosa.feature.melspectrogram
- librosa.feature.melspectrogram(*, y=None, sr=22050, S=None, n_fft=2048, hop_length=512, win_length=None, window='hann', center=True, pad_mode='constant', power=2.0, **kwargs)[source]
Compute a mel-scaled spectrogram.
If a spectrogram input
Sis provided, then it is mapped directly onto the mel basis bymel_f.dot(S).If a time-series input
y, sris provided, then its magnitude spectrogramSis first computed, and then mapped onto the mel scale bymel_f.dot(S**power).By default,
power=2operates on a power spectrum.- Parameters:
- ynp.ndarray [shape=(…, n)] or None
audio time-series. Multi-channel is supported.
- srnumber > 0 [scalar]
sampling rate of
y- Snp.ndarray [shape=(…, d, t)]
spectrogram
- n_fftint > 0 [scalar]
length of the FFT window
- hop_lengthint > 0 [scalar]
number of samples between successive frames. See
librosa.stft- win_lengthint <= n_fft [scalar]
Each frame of audio is windowed by window(). The window will be of length win_length and then padded with zeros to match
n_fft. If unspecified, defaults towin_length = n_fft.- windowstring, tuple, number, function, or np.ndarray [shape=(n_fft,)]
a window specification (string, tuple, or number); see
scipy.signal.get_windowa window function, such as
scipy.signal.windows.hanna vector or array of length
n_fft
- centerboolean
If True, the signal
yis padded so that frametis centered aty[t * hop_length].If False, then frame
tbegins aty[t * hop_length]
- pad_modestring
If
center=True, the padding mode to use at the edges of the signal. By default, STFT uses zero padding.- powerfloat > 0 [scalar]
Exponent for the magnitude melspectrogram. e.g., 1 for energy, 2 for power, etc.
- **kwargsadditional keyword arguments for Mel filter bank parameters
- n_melsint > 0 [scalar]
number of Mel bands to generate
- fminfloat >= 0 [scalar]
lowest frequency (in Hz)
- fmaxfloat >= 0 [scalar]
highest frequency (in Hz). If None, use
fmax = sr / 2.0- htkbool [scalar]
use HTK formula instead of Slaney
- norm{None, ‘slaney’, or number} [scalar]
If ‘slaney’, divide the triangular mel weights by the width of the mel band (area normalization). If numeric, use
librosa.util.normalizeto normalize each filter by to unit l_p norm. Seelibrosa.util.normalizefor a full description of supported norm values (including +-np.inf). Otherwise, leave all the triangles aiming for a peak value of 1.0- dtypenp.dtype
The data type of the output basis. By default, uses 32-bit (single-precision) floating point.
- Returns:
- Snp.ndarray [shape=(…, n_mels, t)]
Mel spectrogram
See also
librosa.filters.melMel filter bank construction
librosa.stftShort-time Fourier Transform
Examples
>>> y, sr = librosa.load(librosa.ex('trumpet'))
>>> librosa.feature.melspectrogram(y=y, sr=sr)
array([[3.837e-06, 1.451e-06, ..., 8.352e-14, 1.296e-11],
       [2.213e-05, 7.866e-06, ..., 8.532e-14, 1.329e-11],
       ...,
       [1.115e-05, 5.192e-06, ..., 3.675e-08, 2.470e-08],
       [6.473e-07, 4.402e-07, ..., 1.794e-08, 2.908e-08]],
      dtype=float32)
Using a pre-computed power spectrogram would give the same result:
>>> D = np.abs(librosa.stft(y))**2
>>> S = librosa.feature.melspectrogram(S=D, sr=sr)
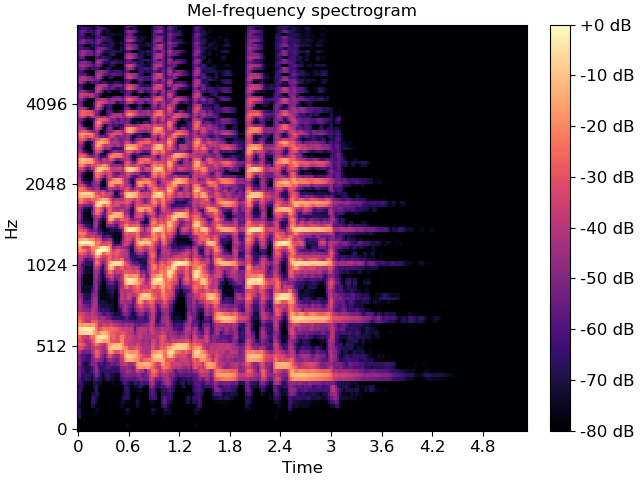
Display of mel-frequency spectrogram coefficients, with custom arguments for mel filterbank construction (default is fmax=sr/2):
>>> # Passing through arguments to the Mel filters
>>> S = librosa.feature.melspectrogram(y=y, sr=sr, n_mels=128,
...                                     fmax=8000)
>>> import matplotlib.pyplot as plt
>>> fig, ax = plt.subplots()
>>> S_dB = librosa.power_to_db(S, ref=np.max)
>>> img = librosa.display.specshow(S_dB, x_axis='time',
...                          y_axis='mel', sr=sr,
...                          fmax=8000, ax=ax)
>>> fig.colorbar(img, ax=ax, format='%+2.0f dB')
>>> ax.set(title='Mel-frequency spectrogram')