Caution
You're reading the documentation for a development version. For the latest released version, please have a look at 0.11.0.
librosa.segment.recurrence_matrix
- librosa.segment.recurrence_matrix(data, *, k=None, width=1, metric='euclidean', sym=False, sparse=False, mode='connectivity', bandwidth=None, self=False, axis=-1, full=False)[source]
Compute a recurrence matrix from a data matrix.
rec[i, j]is non-zero ifdata[..., i]is a k-nearest neighbor ofdata[..., j]and|i - j| >= widthThe specific value of
rec[i, j]can have several forms, governed by themodeparameter below:Connectivity:
rec[i, j] = 1 or 0indicates that framesiandjare repetitionsAffinity:
rec[i, j] > 0measures how similar framesiandjare. This is also known as a (sparse) self-similarity matrix.Distance:
rec[i, j] > 0measures how distant framesiandjare. This is also known as a (sparse) self-distance matrix.
The general term recurrence matrix can refer to any of the three forms above.
- Parameters:
- datanp.ndarray [shape=(…, d, n)]
A feature matrix. If the data has more than two dimensions (e.g., for multi-channel inputs), the leading dimensions are flattened prior to comparison. For example, a stereo input with shape (2, d, n) is automatically reshaped to (2 * d, n).
- kint > 0 [scalar] or None
the number of nearest-neighbors for each sample
Default:
k = 2 * ceil(sqrt(t - 2 * width + 1)), ork = 2ift <= 2 * width + 1- widthint >= 1 [scalar]
only link neighbors
(data[..., i], data[..., j])if|i - j| >= widthwidthcannot exceed the length of the data.- metricstr
Distance metric to use for nearest-neighbor calculation.
See
sklearn.neighbors.NearestNeighborsfor details.- symbool [scalar]
set
sym=Trueto only link mutual nearest-neighbors- sparsebool [scalar]
if False, returns a dense type (ndarray) if True, returns a sparse type (scipy.sparse.csc_matrix)
- modestr, {‘connectivity’, ‘distance’, ‘affinity’}
If ‘connectivity’, a binary connectivity matrix is produced.
If ‘distance’, then a non-zero entry contains the distance between points.
If ‘affinity’, then non-zero entries are mapped to
exp( - distance(i, j) / bandwidth)wherebandwidthis as specified below.- bandwidthNone, float > 0, ndarray, or str
str options include
{'med_k_scalar', 'mean_k', 'gmean_k', 'mean_k_avg', 'gmean_k_avg', 'mean_k_avg_and_pair'}If ndarray is supplied, use ndarray as bandwidth for each i,j pair.
If using
mode='affinity', thebandwidthoption can be used to set the bandwidth on the affinity kernel.If no value is provided or
None, default to'med_k_scalar'.If
bandwidth='med_k_scalar', a scalar bandwidth is set to the median distance of the k-th nearest neighbor for all samples.If
bandwidth='mean_k', bandwidth is estimated for each sample-pair (i, j) by taking the arithmetic mean between distances to the k-th nearest neighbor for sample i and sample j.If
bandwidth='gmean_k', bandwidth is estimated for each sample-pair (i, j) by taking the geometric mean between distances to the k-th nearest neighbor for sample i and j [1].If
bandwidth='mean_k_avg', bandwidth is estimated for each sample-pair (i, j) by taking the arithmetic mean between the average distances to the first k-th nearest neighbors for sample i and sample j. This is similar to the approach in Wang et al. (2014) [2] but does not include the distance between i and j.If
bandwidth='gmean_k_avg', bandwidth is estimated for each sample-pair (i, j) by taking the geometric mean between the average distances to the first k-th nearest neighbors for sample i and sample j.If
bandwidth='mean_k_avg_and_pair', bandwidth is estimated for each sample-pair (i, j) by taking the arithmetic mean between three terms: the average distances to the first k-th nearest neighbors for sample i and sample j respectively, as well as the distance between i and j. This is similar to the approach in Wang et al. (2014). [2]- selfbool
If
True, then the main diagonal is populated with self-links: 0 ifmode='distance', and 1 otherwise.If
False, the main diagonal is left empty.- axisint
The axis along which to compute recurrence. By default, the last index (-1) is taken.
- fullbool
If using
mode ='affinity'ormode='distance', this option can be used to compute the full affinity or distance matrix as opposed a sparse matrix with only none-zero terms for the first k-neighbors of each sample. This option has no effect when usingmode='connectivity'.When using
mode='distance', settingfull=Truewill ignorekandwidth. When usingmode='affinity', settingfull=Truewill usekexclusively for bandwidth estimation, and ignorewidth.
- Returns:
- recnp.ndarray or scipy.sparse.csc_matrix, [shape=(t, t)]
Recurrence matrix
See also
Notes
This function caches at level 30.
Examples
Find nearest neighbors in CQT space
>>> y, sr = librosa.load(librosa.ex('nutcracker'))
>>> hop_length = 1024
>>> chroma = librosa.feature.chroma_cqt(y=y, sr=sr, hop_length=hop_length)
>>> # Use time-delay embedding to get a cleaner recurrence matrix
>>> chroma_stack = librosa.feature.stack_memory(chroma, n_steps=10, delay=3)
>>> R = librosa.segment.recurrence_matrix(chroma_stack)
Or fix the number of nearest neighbors to 5
>>> R = librosa.segment.recurrence_matrix(chroma_stack, k=5)
Suppress neighbors within +- 7 frames
>>> R = librosa.segment.recurrence_matrix(chroma_stack, width=7)
Use cosine similarity instead of Euclidean distance
>>> R = librosa.segment.recurrence_matrix(chroma_stack, metric='cosine')
Require mutual nearest neighbors
>>> R = librosa.segment.recurrence_matrix(chroma_stack, sym=True)
Use an affinity matrix instead of binary connectivity
>>> R_aff = librosa.segment.recurrence_matrix(chroma_stack, metric='cosine',
...                                           mode='affinity')
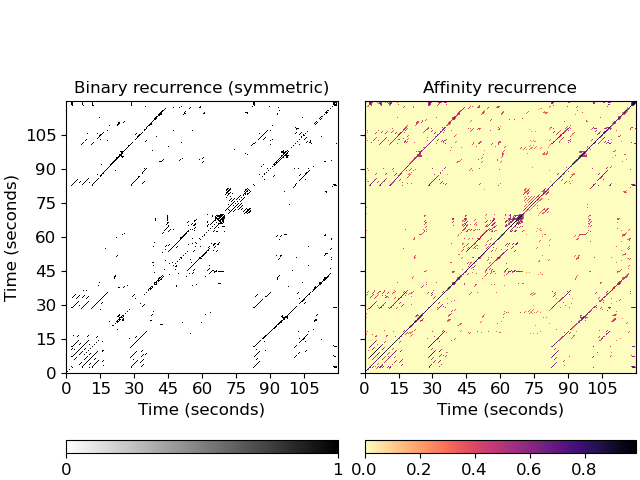
Plot the feature and recurrence matrices
>>> import matplotlib.pyplot as plt
>>> fig, ax = plt.subplots(ncols=2, sharex=True, sharey=True)
>>> imgsim = librosa.display.specshow(R, x_axis='s', y_axis='s',
...                          hop_length=hop_length, ax=ax[0])
>>> ax[0].set(title='Binary recurrence (symmetric)')
>>> imgaff = librosa.display.specshow(R_aff, x_axis='s', y_axis='s',
...                          hop_length=hop_length, cmap='magma_r', ax=ax[1])
>>> ax[1].set(title='Affinity recurrence')
>>> ax[1].label_outer()
>>> fig.colorbar(imgsim, ax=ax[0], orientation='horizontal', ticks=[0, 1])
>>> fig.colorbar(imgaff, ax=ax[1], orientation='horizontal')