Caution
You're reading the documentation for a development version. For the latest released version, please have a look at 0.11.0.
librosa.f0_harmonics
- librosa.f0_harmonics(x, *, f0, freqs, harmonics, kind='linear', fill_value=0, axis=-2)[source]
Compute the energy at selected harmonics of a time-varying fundamental frequency.
This function can be used to reduce a frequency * time representation to a harmonic * time representation, effectively normalizing out for the fundamental frequency. The result can be used as a representation of timbre when f0 corresponds to pitch, or as a representation of rhythm when f0 corresponds to tempo.
This function differs from
interp_harmonics, which computes the harmonics of all frequencies.- Parameters:
- xnp.ndarray [shape=(…, frequencies, n)]
The input array (e.g., STFT magnitudes)
- f0np.ndarray [shape=(…, n)]
The fundamental frequency (f0) of each frame in the input Shape should match
x.shape[-1]- freqsnp.ndarray, shape=(x.shape[axis]) or shape=x.shape
The frequency values corresponding to X’s elements along the chosen axis. Frequencies can also be time-varying, e.g. as computed by
reassigned_spectrogram, in which case the shape should matchx.- harmonicslist-like, non-negative
Harmonics to compute as
harmonics[i] * f0Values less than one (e.g., 1/2) correspond to sub-harmonics.- kindstr
Interpolation type. See
scipy.interpolate.interp1d.- fill_valuefloat
The value to fill when extrapolating beyond the observed frequency range.
- axisint
The axis corresponding to frequency in
x
- Returns:
- f0_harmnp.ndarray [shape=(…, len(harmonics), n)]
Interpolated energy at each specified harmonic of the fundamental frequency for each time step.
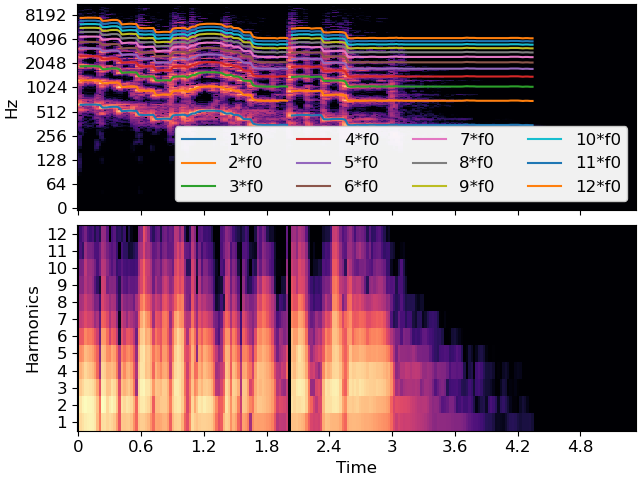
Examples
This example estimates the fundamental (f0), and then extracts the first 12 harmonics
>>> y, sr = librosa.load(librosa.ex('trumpet'))
>>> f0, voicing, voicing_p = librosa.pyin(y=y, sr=sr, fmin=200, fmax=700)
>>> S = np.abs(librosa.stft(y))
>>> freqs = librosa.fft_frequencies(sr=sr)
>>> harmonics = np.arange(1, 13)
>>> f0_harm = librosa.f0_harmonics(S, freqs=freqs, f0=f0, harmonics=harmonics)
>>> import matplotlib.pyplot as plt
>>> fig, ax =plt.subplots(nrows=2, sharex=True)
>>> librosa.display.specshow(librosa.amplitude_to_db(S, ref=np.max),
...                          x_axis='time', y_axis='log', ax=ax[0])
>>> times = librosa.times_like(f0)
>>> for h in harmonics:
...     ax[0].plot(times, h * f0, label=f"{h}*f0")
>>> ax[0].legend(ncols=4, loc='lower right')
>>> ax[0].label_outer()
>>> librosa.display.specshow(librosa.amplitude_to_db(f0_harm, ref=np.max),
...                          x_axis='time', ax=ax[1])
>>> ax[1].set_yticks(harmonics-1)
>>> ax[1].set_yticklabels(harmonics)
>>> ax[1].set(ylabel='Harmonics')