Caution
You're reading the documentation for a development version. For the latest released version, please have a look at 0.11.0.
librosa.griffinlim
- librosa.griffinlim(S, *, n_iter=32, hop_length=None, win_length=None, n_fft=None, window='hann', center=True, dtype=None, length=None, pad_mode='constant', momentum=0.99, init='random', rng=None, random_state=<DEPRECATED parameter>)[source]
Approximate magnitude spectrogram inversion using the “fast” Griffin-Lim algorithm.
Given a short-time Fourier transform magnitude matrix (
S), the algorithm randomly initializes phase estimates, and then alternates forward- and inverse-STFT operations. [1]Note that this assumes reconstruction of a real-valued time-domain signal, and that
Scontains only the non-negative frequencies (as computed bystft).The “fast” GL method [2] uses a momentum parameter to accelerate convergence.
- Parameters:
- Snp.ndarray [shape=(…, n_fft // 2 + 1, t), non-negative]
An array of short-time Fourier transform magnitudes as produced by
stft.- n_iterint > 0
The number of iterations to run
- hop_lengthNone or int > 0
The hop length of the STFT. If not provided, it will default to
n_fft // 4- win_lengthNone or int > 0
The window length of the STFT. By default, it will equal
n_fft- n_fftNone or int > 0
The number of samples per frame. By default, this will be inferred from the shape of
Sas an even number. However, if an odd frame length was used, you can explicitly setn_fft.- windowstr, tuple, number, function, or np.ndarray [shape=(n_fft,)]
- centerbool
If
True, the STFT is assumed to use centered frames. IfFalse, the STFT is assumed to use left-aligned frames.- dtypenp.dtype
Real numeric type for the time-domain signal. Default is inferred to match the precision of the input spectrogram.
- lengthNone or int > 0
If provided, the output
yis zero-padded or clipped to exactlylengthsamples.- pad_modestr
If
center=True, the padding mode to use at the edges of the signal. By default, STFT uses zero padding.- momentumnumber >= 0
The momentum parameter for fast Griffin-Lim. Setting this to 0 recovers the original Griffin-Lim method [1]. Values near 1 can lead to faster convergence, but above 1 may not converge.
- initNone or ‘random’ [default]
If ‘random’ (the default), then phase values are initialized randomly according to
random_state. This is recommended when the inputSis a magnitude spectrogram with no initial phase estimates.If None, then the phase is initialized from
S. This is useful when an initial guess for phase can be provided, or when you want to resume Griffin-Lim from a previous output.- rngNone, int, sequence of int, np.random.Generator, or np.random.RandomState
Pseudorandom number generator state. When rng is None, a new
numpy.random.Generatoris created using entropy from the operating system. Types other thannumpy.random.Generatorare passed tonumpy.random.default_rngto instantiate aGenerator.- random_stateNone, int, np.random.RandomState, or np.random.Generator
Warning
This parameter is deprecated in 1.0.0 and will be removed in 1.2.0.
If int, random_state is the seed used by the random number generator for phase initialization.
If np.random.RandomState or np.random.Generator instance, the random number generator itself.
If None, defaults to the np.random.default_rng() object.
An exception is raised if both rng and random_state are provided.
- Returns:
- ynp.ndarray [shape=(…, n)]
time-domain signal reconstructed from
S
See also
Examples
A basic STFT inverse example
>>> y, sr = librosa.loadx('trumpet')
>>> # Get the magnitude spectrogram
>>> S = np.abs(librosa.stft(y))
>>> # Invert using Griffin-Lim
>>> y_inv = librosa.griffinlim(S)
>>> # Invert without estimating phase
>>> y_istft = librosa.istft(S)
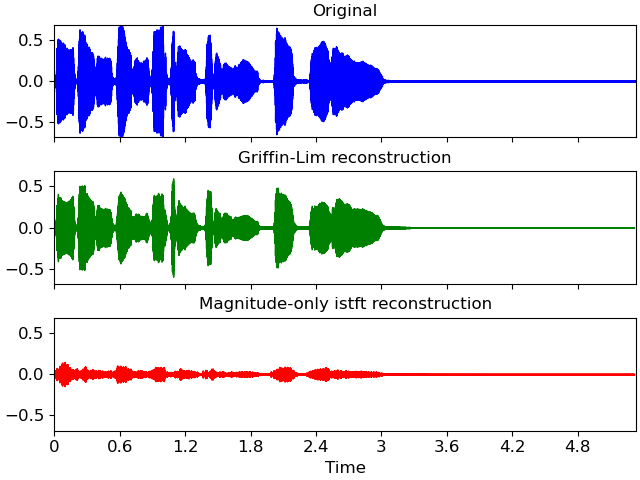
Wave-plot the results
>>> import matplotlib.pyplot as plt
>>> fig, ax = plt.subplots(nrows=3, sharex=True, sharey=True)
>>> librosa.display.waveshow(y, sr=sr, color='C0', ax=ax[0])
>>> ax[0].set(title='Original', xlabel=None)
>>> ax[0].label_outer()
>>> librosa.display.waveshow(y_inv, sr=sr, color='C1', ax=ax[1])
>>> ax[1].set(title='Griffin-Lim reconstruction', xlabel=None)
>>> ax[1].label_outer()
>>> librosa.display.waveshow(y_istft, sr=sr, color='C2', ax=ax[2])
>>> ax[2].set_title('Magnitude-only istft reconstruction')