Caution
You're reading an old version of this documentation. If you want up-to-date information, please have a look at 0.9.1.
librosa.core.clicks
- librosa.core.clicks(times=None, frames=None, sr=22050, hop_length=512, click_freq=1000.0, click_duration=0.1, click=None, length=None)[source]
Returns a signal with the signal click placed at each specified time
- Parameters
- timesnp.ndarray or None
times to place clicks, in seconds
- framesnp.ndarray or None
frame indices to place clicks
- srnumber > 0
desired sampling rate of the output signal
- hop_lengthint > 0
if positions are specified by frames, the number of samples between frames.
- click_freqfloat > 0
frequency (in Hz) of the default click signal. Default is 1KHz.
- click_durationfloat > 0
duration (in seconds) of the default click signal. Default is 100ms.
- clicknp.ndarray or None
optional click signal sample to use instead of the default blip.
- lengthint > 0
desired number of samples in the output signal
- Returns
- click_signalnp.ndarray
Synthesized click signal
- Raises
- ParameterError
If neither times nor frames are provided.
If any of click_freq, click_duration, or length are out of range.
Examples
>>> # Sonify detected beat events
>>> y, sr = librosa.load(librosa.util.example_audio_file())
>>> tempo, beats = librosa.beat.beat_track(y=y, sr=sr)
>>> y_beats = librosa.clicks(frames=beats, sr=sr)
>>> # Or generate a signal of the same length as y
>>> y_beats = librosa.clicks(frames=beats, sr=sr, length=len(y))
>>> # Or use timing instead of frame indices
>>> times = librosa.frames_to_time(beats, sr=sr)
>>> y_beat_times = librosa.clicks(times=times, sr=sr)
>>> # Or with a click frequency of 880Hz and a 500ms sample
>>> y_beat_times880 = librosa.clicks(times=times, sr=sr,
...                                  click_freq=880, click_duration=0.5)
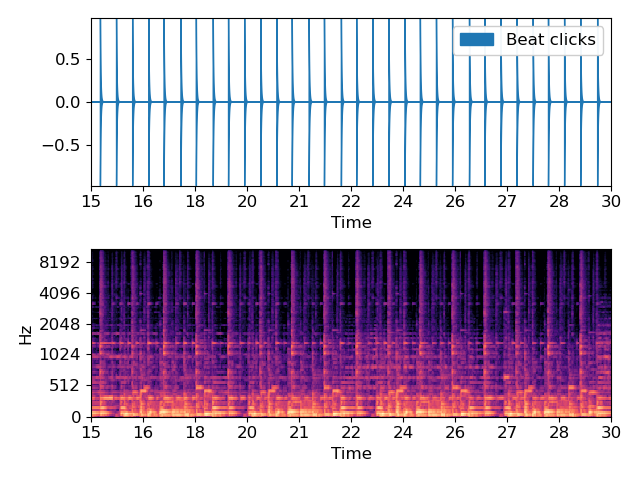
Display click waveform next to the spectrogram
>>> import matplotlib.pyplot as plt
>>> plt.figure()
>>> S = librosa.feature.melspectrogram(y=y, sr=sr)
>>> ax = plt.subplot(2,1,2)
>>> librosa.display.specshow(librosa.power_to_db(S, ref=np.max),
...                          x_axis='time', y_axis='mel')
>>> plt.subplot(2,1,1, sharex=ax)
>>> librosa.display.waveplot(y_beat_times, sr=sr, label='Beat clicks')
>>> plt.legend()
>>> plt.xlim(15, 30)
>>> plt.tight_layout()
>>> plt.show()