Caution
You're reading an old version of this documentation. If you want up-to-date information, please have a look at 0.9.1.
librosa.filters.mel
- librosa.filters.mel(sr, n_fft, n_mels=128, fmin=0.0, fmax=None, htk=False, norm='slaney', dtype=<class 'numpy.float32'>)[source]
Create a Filterbank matrix to combine FFT bins into Mel-frequency bins
- Parameters
- srnumber > 0 [scalar]
sampling rate of the incoming signal
- n_fftint > 0 [scalar]
number of FFT components
- n_melsint > 0 [scalar]
number of Mel bands to generate
- fminfloat >= 0 [scalar]
lowest frequency (in Hz)
- fmaxfloat >= 0 [scalar]
highest frequency (in Hz). If None, use fmax = sr / 2.0
- htkbool [scalar]
use HTK formula instead of Slaney
- norm{None, 1, ‘slaney’, np.inf} [scalar]
If 1 or ‘slaney’, divide the triangular mel weights by the width of the mel band (area normalization).
Warning
norm=1 and norm=np.inf behavior will change in version 0.8.0.
Otherwise, leave all the triangles aiming for a peak value of 1.0
- dtypenp.dtype
The data type of the output basis. By default, uses 32-bit (single-precision) floating point.
- Returns
- Mnp.ndarray [shape=(n_mels, 1 + n_fft/2)]
Mel transform matrix
Notes
This function caches at level 10.
Examples
>>> melfb = librosa.filters.mel(22050, 2048)
>>> melfb
array([[ 0.   ,  0.016, ...,  0.   ,  0.   ],
       [ 0.   ,  0.   , ...,  0.   ,  0.   ],
       ...,
       [ 0.   ,  0.   , ...,  0.   ,  0.   ],
       [ 0.   ,  0.   , ...,  0.   ,  0.   ]])
Clip the maximum frequency to 8KHz
>>> librosa.filters.mel(22050, 2048, fmax=8000)
array([[ 0.  ,  0.02, ...,  0.  ,  0.  ],
       [ 0.  ,  0.  , ...,  0.  ,  0.  ],
       ...,
       [ 0.  ,  0.  , ...,  0.  ,  0.  ],
       [ 0.  ,  0.  , ...,  0.  ,  0.  ]])
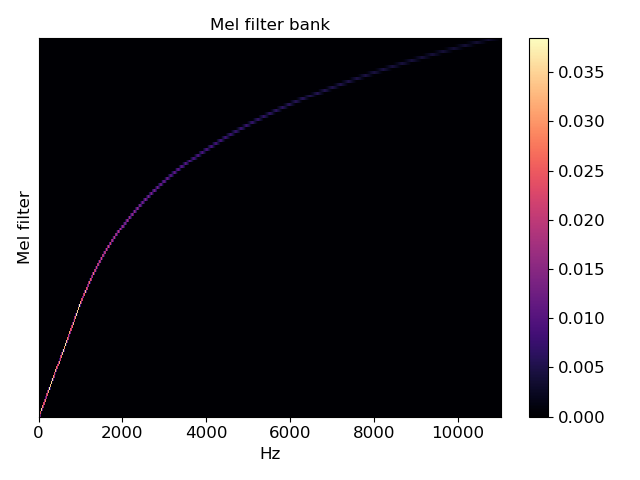
>>> import matplotlib.pyplot as plt
>>> plt.figure()
>>> librosa.display.specshow(melfb, x_axis='linear')
>>> plt.ylabel('Mel filter')
>>> plt.title('Mel filter bank')
>>> plt.colorbar()
>>> plt.tight_layout()
>>> plt.show()