Caution
You're reading an old version of this documentation. If you want up-to-date information, please have a look at 0.10.2.
Note
Go to the end to download the full example code.
Rainbowgrams
This notebook demonstrates how to use “Rainbowgrams” to simultaneously visualize amplitude and (unwrapped) phase (differential) as demonstrated in the NSynth paper [1].
# Code source: Brian McFee
# License: ISC
Standard imports
import numpy as np
import matplotlib.pyplot as plt
import librosa
We implemented a stft method to visualize the rainbowgram and demonstrated the result with a chirp signal. A chirp signal starts at a low frequency and gradually increases in frequency over time. We then separated the magnitude and phase components of the signal
sr = 22050
y = librosa.chirp(fmin=32, fmax=32 * 2**5, sr=sr, duration=10, linear=True)
D = librosa.stft(y)
mag, phase = librosa.magphase(D)
We should be visualizing the demodulated phase differential derived by subtracting 2π*f*t from each phase estimate prior to unwrapping, where f and t are the frequency and time.
freqs = librosa.fft_frequencies()
times = librosa.times_like(D)

phase_exp = 2*np.pi*np.multiply.outer(freqs,times)
Plot the spectrum.
fig, ax = plt.subplots()
img = librosa.display.specshow(np.diff(np.unwrap(np.angle(phase)-phase_exp, axis=1), axis=1, prepend=0),
                         cmap='hsv',
                         alpha=librosa.amplitude_to_db(mag, ref=np.max)/80 + 1,
                         ax=ax,
                         y_axis='log',
                         x_axis='time')
ax.set_facecolor('#000')
cbar = fig.colorbar(img, ticks=[-np.pi, -np.pi/2, 0, np.pi/2, np.pi])
cbar.ax.set(yticklabels=['-π', '-π/2', "0", 'π/2', 'π']);
plt.show()
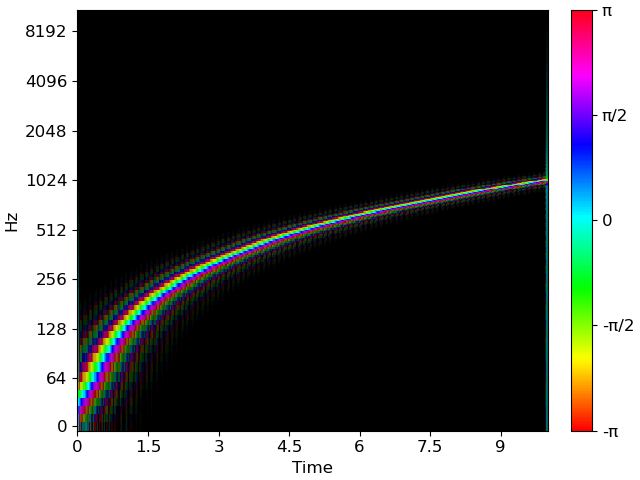
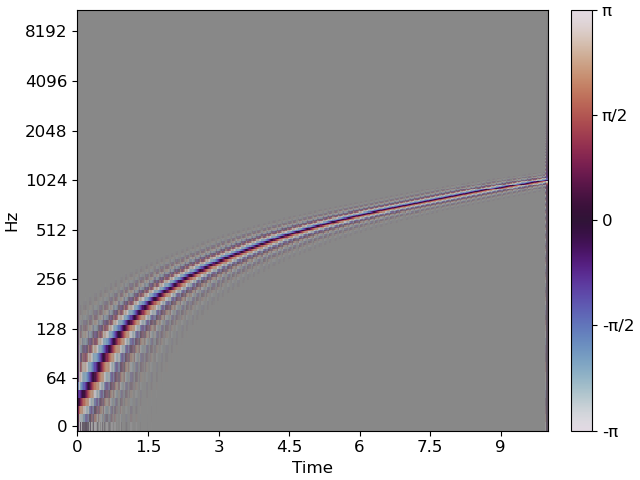
The above uses HSV colormap for phase fading to a black background. The twilight colormap can also work here, with the caveat that it uses black to code the extremes of the map (ie 0). We can sidestep this by using a neutral axis facecolor:
fig, ax = plt.subplots()
img = librosa.display.specshow(np.diff(np.unwrap(np.angle(phase)-phase_exp, axis=1), axis=1, prepend=0),
                         cmap='twilight',
                         alpha=librosa.amplitude_to_db(mag, ref=np.max)/80 + 1,
                         ax=ax,
                         y_axis='log',
                         x_axis='time')
ax.set_facecolor('#888')
cbar = fig.colorbar(img, ticks=[-np.pi, -np.pi/2, 0, np.pi/2, np.pi])
cbar.ax.set(yticklabels=['-π', '-π/2', 0, 'π/2', 'π'])
Total running time of the script: (0 minutes 5.391 seconds)