Caution
You're reading an old version of this documentation. If you want up-to-date information, please have a look at 0.11.0.
librosa.feature.spectral_rolloff
- librosa.feature.spectral_rolloff(*, y=None, sr=22050, S=None, n_fft=2048, hop_length=512, win_length=None, window='hann', center=True, pad_mode='constant', freq=None, roll_percent=0.85)[source]
Compute roll-off frequency.
The roll-off frequency is defined for each frame as the center frequency for a spectrogram bin such that at least roll_percent (0.85 by default) of the energy of the spectrum in this frame is contained in this bin and the bins below. This can be used to, e.g., approximate the maximum (or minimum) frequency by setting roll_percent to a value close to 1 (or 0).
- Parameters:
- ynp.ndarray [shape=(…, n)] or None
audio time series. Multi-channel is supported.
- srnumber > 0 [scalar]
audio sampling rate of
y- Snp.ndarray [shape=(d, t)] or None
(optional) spectrogram magnitude
- n_fftint > 0 [scalar]
FFT window size
- hop_lengthint > 0 [scalar]
hop length for STFT. See
librosa.stftfor details.- win_lengthint <= n_fft [scalar]
Each frame of audio is windowed by window(). The window will be of length win_length and then padded with zeros to match
n_fft.If unspecified, defaults to
win_length = n_fft.- windowstring, tuple, number, function, or np.ndarray [shape=(n_fft,)]
a window specification (string, tuple, or number); see
scipy.signal.get_windowa window function, such as
scipy.signal.windows.hanna vector or array of length
n_fft
- centerboolean
If True, the signal
yis padded so that frametis centered aty[t * hop_length].If False, then frame
tbegins aty[t * hop_length]
- pad_modestring
If
center=True, the padding mode to use at the edges of the signal. By default, STFT uses zero padding.- freqNone or np.ndarray [shape=(d,) or shape=(…, d, t)]
Center frequencies for spectrogram bins. If None, then FFT bin center frequencies are used. Otherwise, it can be a single array of
dcenter frequencies,Note
freqis assumed to be sorted in increasing order- roll_percentfloat [0 < roll_percent < 1]
Roll-off percentage.
- Returns:
- rolloffnp.ndarray [shape=(…, 1, t)]
roll-off frequency for each frame
Examples
From time-series input
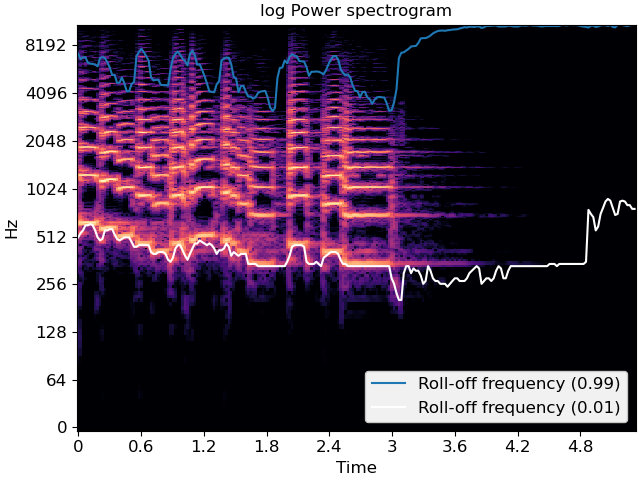
>>> y, sr = librosa.load(librosa.ex('trumpet'))
>>> # Approximate maximum frequencies with roll_percent=0.85 (default)
>>> librosa.feature.spectral_rolloff(y=y, sr=sr)
array([[2583.984, 3036.182, ..., 9173.145, 9248.511]])
>>> # Approximate maximum frequencies with roll_percent=0.99
>>> rolloff = librosa.feature.spectral_rolloff(y=y, sr=sr, roll_percent=0.99)
>>> rolloff
array([[ 7192.09 ,  6739.893, ..., 10960.4  , 10992.7  ]])
>>> # Approximate minimum frequencies with roll_percent=0.01
>>> rolloff_min = librosa.feature.spectral_rolloff(y=y, sr=sr, roll_percent=0.01)
>>> rolloff_min
array([[516.797, 538.33 , ..., 764.429, 764.429]])
From spectrogram input
>>> S, phase = librosa.magphase(librosa.stft(y))
>>> librosa.feature.spectral_rolloff(S=S, sr=sr)
array([[2583.984, 3036.182, ..., 9173.145, 9248.511]])
>>> # With a higher roll percentage:
>>> librosa.feature.spectral_rolloff(y=y, sr=sr, roll_percent=0.95)
array([[ 3919.043,  3994.409, ..., 10443.604, 10594.336]])
>>> import matplotlib.pyplot as plt
>>> fig, ax = plt.subplots()
>>> librosa.display.specshow(librosa.amplitude_to_db(S, ref=np.max),
...                          y_axis='log', x_axis='time', ax=ax)
>>> ax.plot(librosa.times_like(rolloff), rolloff[0], label='Roll-off frequency (0.99)')
>>> ax.plot(librosa.times_like(rolloff), rolloff_min[0], color='w',
...         label='Roll-off frequency (0.01)')
>>> ax.legend(loc='lower right')
>>> ax.set(title='log Power spectrogram')