Caution
You're reading an old version of this documentation. If you want up-to-date information, please have a look at 0.11.0.
librosa.feature.chroma_cqt
- librosa.feature.chroma_cqt(*, y=None, sr=22050, C=None, hop_length=512, fmin=None, norm=inf, threshold=0.0, tuning=None, n_chroma=12, n_octaves=7, window=None, bins_per_octave=36, cqt_mode='full')[source]
Constant-Q chromagram
- Parameters:
- ynp.ndarray [shape=(…, n,)]
audio time series. Multi-channel is supported.
- srnumber > 0
sampling rate of
y- Cnp.ndarray [shape=(…, d, t)] [Optional]
a pre-computed constant-Q spectrogram
- hop_lengthint > 0
number of samples between successive chroma frames
- fminfloat > 0
minimum frequency to analyze in the CQT.
Default: C1 ~= 32.7 Hz
- normint > 0, +-np.inf, or None
Column-wise normalization of the chromagram.
- thresholdfloat
Pre-normalization energy threshold. Values below the threshold are discarded, resulting in a sparse chromagram.
- tuningfloat
Deviation (in fractions of a CQT bin) from A440 tuning
- n_chromaint > 0
Number of chroma bins to produce
- n_octavesint > 0
Number of octaves to analyze above
fmin- windowNone or np.ndarray
Optional window parameter to filters.cq_to_chroma
- bins_per_octaveint > 0, optional
Number of bins per octave in the CQT. Must be an integer multiple of
n_chroma. Default: 36 (3 bins per semitone)If None, it will match
n_chroma.- cqt_mode[‘full’, ‘hybrid’]
Constant-Q transform mode
- Returns:
- chromagramnp.ndarray [shape=(…, n_chroma, t)]
The output chromagram
Examples
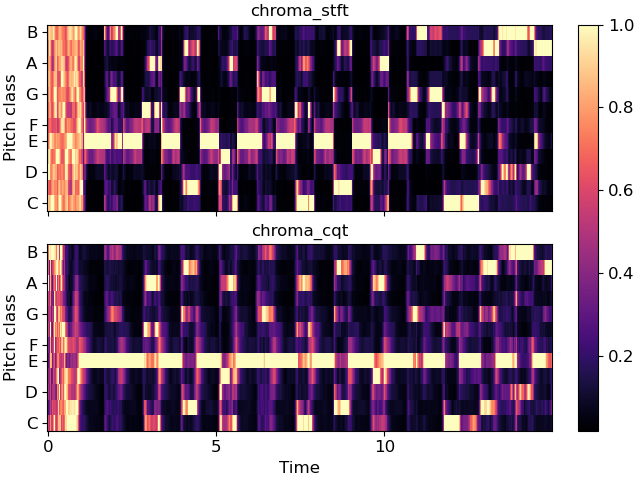
Compare a long-window STFT chromagram to the CQT chromagram
>>> y, sr = librosa.load(librosa.ex('nutcracker'), duration=15)
>>> chroma_stft = librosa.feature.chroma_stft(y=y, sr=sr,
...                                           n_chroma=12, n_fft=4096)
>>> chroma_cq = librosa.feature.chroma_cqt(y=y, sr=sr)
>>> import matplotlib.pyplot as plt
>>> fig, ax = plt.subplots(nrows=2, sharex=True, sharey=True)
>>> librosa.display.specshow(chroma_stft, y_axis='chroma', x_axis='time', ax=ax[0])
>>> ax[0].set(title='chroma_stft')
>>> ax[0].label_outer()
>>> img = librosa.display.specshow(chroma_cq, y_axis='chroma', x_axis='time', ax=ax[1])
>>> ax[1].set(title='chroma_cqt')
>>> fig.colorbar(img, ax=ax)