librosa.filters.wavelet
- librosa.filters.wavelet(*, freqs, sr=22050, window='hann', filter_scale=1, pad_fft=True, norm=1, dtype=<class 'numpy.complex64'>, gamma=0, alpha=None, **kwargs)[source]
Construct a wavelet basis using windowed complex sinusoids.
This function constructs a wavelet filterbank at a specified set of center frequencies.
- Parameters:
- freqsnp.ndarray (positive)
Center frequencies of the filters (in Hz). Must be in ascending order.
- srnumber > 0 [scalar]
Audio sampling rate
- windowstring, tuple, number, or function
Windowing function to apply to filters.
- filter_scalefloat > 0 [scalar]
Scale of filter windows. Small values (<1) use shorter windows for higher temporal resolution.
- pad_fftboolean
Center-pad all filters up to the nearest integral power of 2.
By default, padding is done with zeros, but this can be overridden by setting the
mode=field in kwargs.- norm{inf, -inf, 0, float > 0}
Type of norm to use for basis function normalization. See librosa.util.normalize
- gammanumber >= 0
Bandwidth offset for variable-Q transforms.
- dtypenp.dtype
The data type of the output basis. By default, uses 64-bit (single precision) complex floating point.
- alphanumber > 0 [optional]
Optional pre-computed relative bandwidth parameter. Note that this must be provided if
len(freqs)==1because bandwidth cannot be inferred from a single frequency. Otherwise, if left unspecified, it will be automatically derived by the rules specified above.- **kwargsadditional keyword arguments
Arguments to np.pad() when
pad==True.
- Returns:
- filtersnp.ndarray,
len(filters) == n_bins each
filters[i]is a (complex) time-domain filter- lengthsnp.ndarray,
len(lengths) == n_bins The (fractional) length of each filter in samples
- filtersnp.ndarray,
Notes
This function caches at level 10.
Examples
Create a constant-Q basis
>>> freqs = librosa.cqt_frequencies(n_bins=84, fmin=librosa.note_to_hz('C1'))
>>> basis, lengths = librosa.filters.wavelet(freqs=freqs, sr=22050)
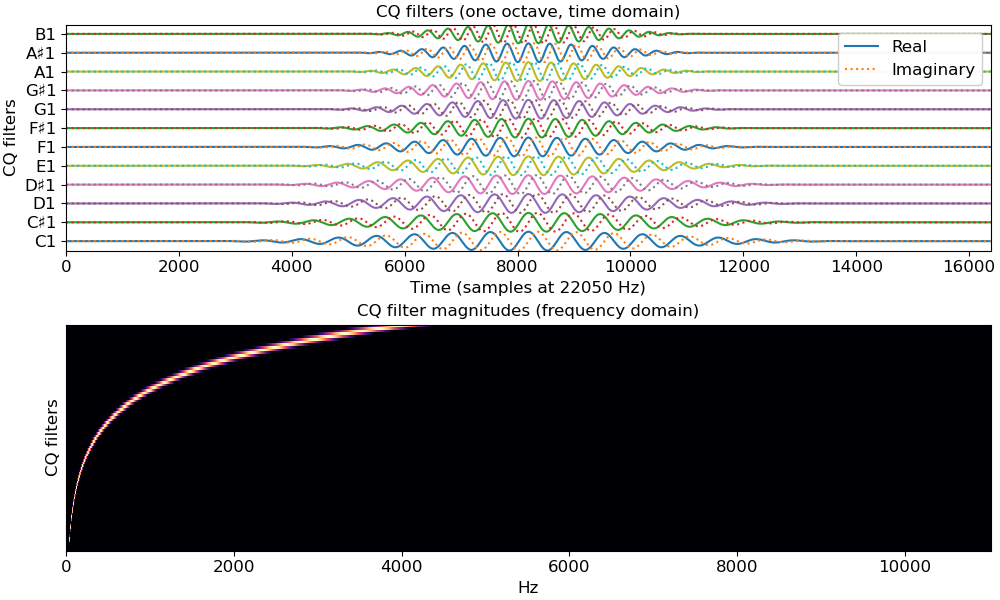
Plot one octave of filters in time and frequency
>>> import matplotlib.pyplot as plt
>>> basis, lengths = librosa.filters.wavelet(freqs=freqs, sr=22050)
>>> fig, ax = plt.subplots(nrows=2, figsize=(10, 6))
>>> notes = librosa.midi_to_note(np.arange(24, 24 + len(basis)))
>>> for i, (f, n) in enumerate(zip(basis, notes[:12])):
...     f_scale = librosa.util.normalize(f) / 2
...     ax[0].plot(i + f_scale.real)
...     ax[0].plot(i + f_scale.imag, linestyle=':')
>>> ax[0].set(yticks=np.arange(len(notes[:12])), yticklabels=notes[:12],
...           ylabel='CQ filters',
...           title='CQ filters (one octave, time domain)',
...           xlabel='Time (samples at 22050 Hz)')
>>> ax[0].legend(['Real', 'Imaginary'])
>>> F = np.abs(np.fft.fftn(basis, axes=[-1]))
>>> # Keep only the positive frequencies
>>> F = F[:, :(1 + F.shape[1] // 2)]
>>> librosa.display.specshow(F, x_axis='linear', y_axis='cqt_note', ax=ax[1])
>>> ax[1].set(ylabel='CQ filters', title='CQ filter magnitudes (frequency domain)')