librosa.interp_harmonics
- librosa.interp_harmonics(x, *, freqs, harmonics, kind='linear', fill_value=0, axis=-2)[source]
Compute the energy at harmonics of time-frequency representation.
Given a frequency-based energy representation such as a spectrogram or tempogram, this function computes the energy at the chosen harmonics of the frequency axis. (See examples below.) The resulting harmonic array can then be used as input to a salience computation.
- Parameters:
- xnp.ndarray
The input energy
- freqsnp.ndarray, shape=(x.shape[axis]) or shape=x.shape
The frequency values corresponding to x’s elements along the chosen axis. Frequencies can also be time-varying, e.g. as computed by
reassigned_spectrogram, in which case the shape should matchx.- harmonicslist-like, non-negative
Harmonics to compute as
harmonics[i] * freqs. The first harmonic (1) corresponds tofreqs. Values less than one (e.g., 1/2) correspond to sub-harmonics.- kindstr
Interpolation type. See
scipy.interpolate.interp1d.- fill_valuefloat
The value to fill when extrapolating beyond the observed frequency range.
- axisint
The axis along which to compute harmonics
- Returns:
- x_harmnp.ndarray
x_harm[i]will have the same shape asx, and measure the energy at theharmonics[i]harmonic of each frequency. A new dimension indexing harmonics will be inserted immediately beforeaxis.
See also
Examples
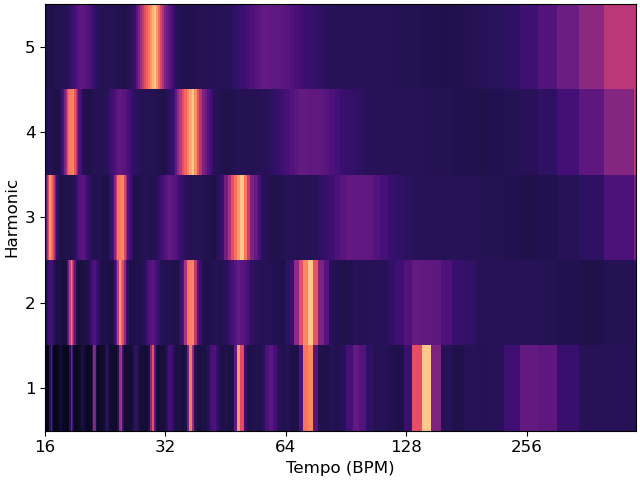
Estimate the harmonics of a time-averaged tempogram
>>> y, sr = librosa.load(librosa.ex('sweetwaltz'))
>>> # Compute the time-varying tempogram and average over time
>>> tempi = np.mean(librosa.feature.tempogram(y=y, sr=sr), axis=1)
>>> # We'll measure the first five harmonics
>>> harmonics = [1, 2, 3, 4, 5]
>>> f_tempo = librosa.tempo_frequencies(len(tempi), sr=sr)
>>> # Build the harmonic tensor; we only have one axis here (tempo)
>>> t_harmonics = librosa.interp_harmonics(tempi, freqs=f_tempo, harmonics=harmonics, axis=0)
>>> print(t_harmonics.shape)
(5, 384)
>>> # And plot the results
>>> import matplotlib.pyplot as plt
>>> fig, ax = plt.subplots()
>>> librosa.display.specshow(t_harmonics, x_axis='tempo', sr=sr, ax=ax)
>>> ax.set(yticks=np.arange(len(harmonics)),
...        yticklabels=['{:.3g}'.format(_) for _ in harmonics],
...        ylabel='Harmonic', xlabel='Tempo (BPM)')
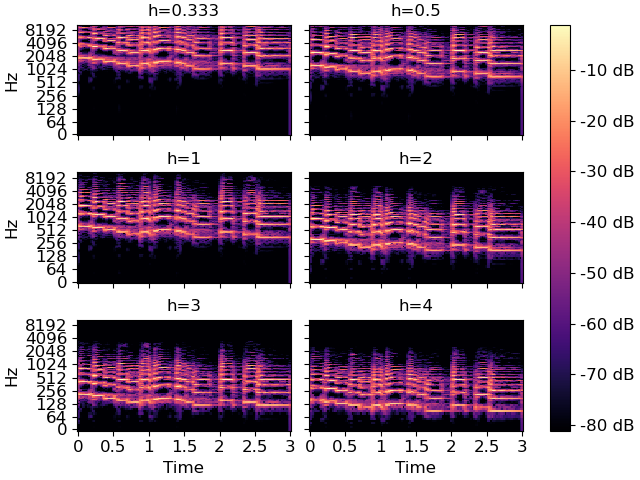
We can also compute frequency harmonics for spectrograms. To calculate sub-harmonic energy, use values < 1.
>>> y, sr = librosa.load(librosa.ex('trumpet'), duration=3)
>>> harmonics = [1./3, 1./2, 1, 2, 3, 4]
>>> S = np.abs(librosa.stft(y))
>>> fft_freqs = librosa.fft_frequencies(sr=sr)
>>> S_harm = librosa.interp_harmonics(S, freqs=fft_freqs, harmonics=harmonics, axis=0)
>>> print(S_harm.shape)
(6, 1025, 646)
>>> fig, ax = plt.subplots(nrows=3, ncols=2, sharex=True, sharey=True)
>>> for i, _sh in enumerate(S_harm):
...     img = librosa.display.specshow(librosa.amplitude_to_db(_sh,
...                                                      ref=S.max()),
...                              sr=sr, y_axis='log', x_axis='time',
...                              ax=ax.flat[i])
...     ax.flat[i].set(title='h={:.3g}'.format(harmonics[i]))
...     ax.flat[i].label_outer()
>>> fig.colorbar(img, ax=ax, format="%+2.f dB")