librosa.pcen
- librosa.pcen(S, *, sr=22050, hop_length=512, gain=0.98, bias=2, power=0.5, time_constant=0.4, eps=1e-06, b=None, max_size=1, ref=None, axis=-1, max_axis=None, zi=None, return_zf=False)[source]
Per-channel energy normalization (PCEN)
This function normalizes a time-frequency representation
Sby performing automatic gain control, followed by nonlinear compression [1]P[f, t] = (S / (eps + M[f, t])**gain + bias)**power - bias**power
IMPORTANT: the default values of eps, gain, bias, and power match the original publication, in which
Sis a 40-band mel-frequency spectrogram with 25 ms windowing, 10 ms frame shift, and raw audio values in the interval [-2**31; 2**31-1[. If you use these default values, we recommend to make sure that the raw audio is properly scaled to this interval, and not to [-1, 1[ as is most often the case.The matrix
Mis the result of applying a low-pass, temporal IIR filter toS:M[f, t] = (1 - b) * M[f, t - 1] + b * S[f, t]
If
bis not provided, it is calculated as:b = (sqrt(1 + 4* T**2) - 1) / (2 * T**2)
where
T = time_constant * sr / hop_length. [2]This normalization is designed to suppress background noise and emphasize foreground signals, and can be used as an alternative to decibel scaling (
amplitude_to_db).This implementation also supports smoothing across frequency bins by specifying
max_size > 1. If this option is used, the filtered spectrogramMis computed as:M[f, t] = (1 - b) * M[f, t - 1] + b * R[f, t]
where
Rhas been max-filtered along the frequency axis, similar to the SuperFlux algorithm implemented inonset.onset_strength:R[f, t] = max(S[f - max_size//2: f + max_size//2, t])
This can be used to perform automatic gain control on signals that cross or span multiple frequency bans, which may be desirable for spectrograms with high frequency resolution.
- Parameters:
- Snp.ndarray (non-negative)
The input (magnitude) spectrogram
- srnumber > 0 [scalar]
The audio sampling rate
- hop_lengthint > 0 [scalar]
The hop length of
S, expressed in samples- gainnumber >= 0 [scalar]
The gain factor. Typical values should be slightly less than 1.
- biasnumber >= 0 [scalar]
The bias point of the nonlinear compression (default: 2)
- powernumber >= 0 [scalar]
The compression exponent. Typical values should be between 0 and 0.5. Smaller values of
powerresult in stronger compression. At the limitpower=0, polynomial compression becomes logarithmic.- time_constantnumber > 0 [scalar]
The time constant for IIR filtering, measured in seconds.
- epsnumber > 0 [scalar]
A small constant used to ensure numerical stability of the filter.
- bnumber in [0, 1] [scalar]
The filter coefficient for the low-pass filter. If not provided, it will be inferred from
time_constant.- max_sizeint > 0 [scalar]
The width of the max filter applied to the frequency axis. If left as 1, no filtering is performed.
- refNone or np.ndarray (shape=S.shape)
An optional pre-computed reference spectrum (
Rin the above). If not provided it will be computed fromS.- axisint [scalar]
The (time) axis of the input spectrogram.
- max_axisNone or int [scalar]
The frequency axis of the input spectrogram. If None, and
Sis two-dimensional, it will be inferred as the opposite fromaxis. IfSis not two-dimensional, andmax_size > 1, an error will be raised.- zinp.ndarray
The initial filter delay values.
This may be the
zf(final delay values) of a previous call topcen, or computed byscipy.signal.lfilter_zi.- return_zfbool
If
True, return the final filter delay values along with the PCEN outputP. This is primarily useful in streaming contexts, where the final state of one block of processing should be used to initialize the next block.If
False(default) only the PCEN valuesPare returned.
- Returns:
- Pnp.ndarray, non-negative [shape=(n, m)]
The per-channel energy normalized version of
S.- zfnp.ndarray (optional)
The final filter delay values. Only returned if
return_zf=True.
Examples
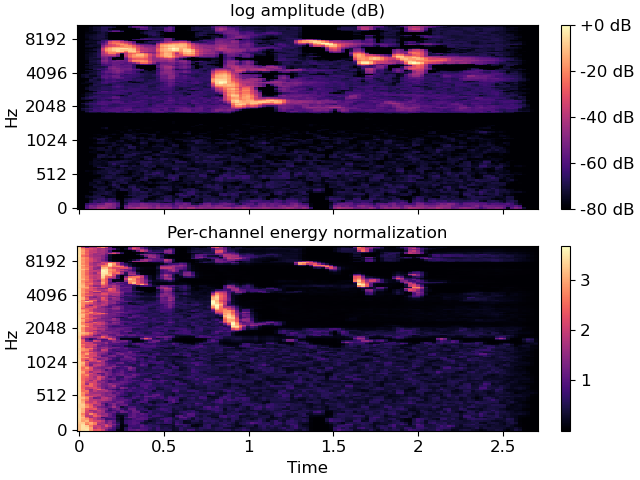
Compare PCEN to log amplitude (dB) scaling on Mel spectra
>>> import matplotlib.pyplot as plt
>>> y, sr = librosa.load(librosa.ex('robin'))
>>> # We recommend scaling y to the range [-2**31, 2**31[ before applying
>>> # PCEN's default parameters. Furthermore, we use power=1 to get a
>>> # magnitude spectrum instead of a power spectrum.
>>> S = librosa.feature.melspectrogram(y=y, sr=sr, power=1)
>>> log_S = librosa.amplitude_to_db(S, ref=np.max)
>>> pcen_S = librosa.pcen(S * (2**31))
>>> fig, ax = plt.subplots(nrows=2, sharex=True, sharey=True)
>>> img = librosa.display.specshow(log_S, x_axis='time', y_axis='mel', ax=ax[0])
>>> ax[0].set(title='log amplitude (dB)', xlabel=None)
>>> ax[0].label_outer()
>>> imgpcen = librosa.display.specshow(pcen_S, x_axis='time', y_axis='mel', ax=ax[1])
>>> ax[1].set(title='Per-channel energy normalization')
>>> fig.colorbar(img, ax=ax[0], format="%+2.0f dB")
>>> fig.colorbar(imgpcen, ax=ax[1])
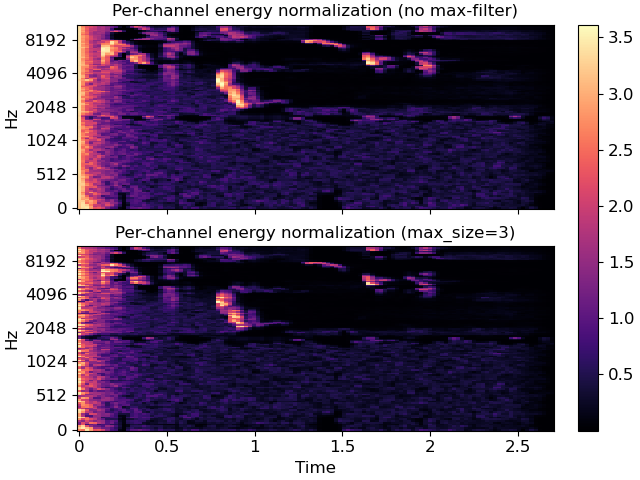
Compare PCEN with and without max-filtering
>>> pcen_max = librosa.pcen(S * (2**31), max_size=3)
>>> fig, ax = plt.subplots(nrows=2, sharex=True, sharey=True)
>>> librosa.display.specshow(pcen_S, x_axis='time', y_axis='mel', ax=ax[0])
>>> ax[0].set(title='Per-channel energy normalization (no max-filter)')
>>> ax[0].label_outer()
>>> img = librosa.display.specshow(pcen_max, x_axis='time', y_axis='mel', ax=ax[1])
>>> ax[1].set(title='Per-channel energy normalization (max_size=3)')
>>> fig.colorbar(img, ax=ax)