librosa.salience
- librosa.salience(S, *, freqs, harmonics, weights=None, aggregate=None, filter_peaks=True, fill_value=nan, kind='linear', axis=-2)[source]
Harmonic salience function.
- Parameters:
- Snp.ndarray [shape=(…, d, n)]
input time frequency magnitude representation (e.g. STFT or CQT magnitudes). Must be real-valued and non-negative.
- freqsnp.ndarray, shape=(S.shape[axis]) or shape=S.shape
The frequency values corresponding to S’s elements along the chosen axis.
Frequencies can also be time-varying, e.g. as computed by
reassigned_spectrogram, in which case the shape should matchS.- harmonicslist-like, non-negative
Harmonics to include in salience computation. The first harmonic (1) corresponds to
Sitself. Values less than one (e.g., 1/2) correspond to sub-harmonics.- weightslist-like
The weight to apply to each harmonic in the summation. (default: uniform weights). Must be the same length as
harmonics.- aggregatefunction
aggregation function (default: np.average)
If
aggregate=np.average, then a weighted average is computed per-harmonic according to the specified weights. For all other aggregation functions, all harmonics are treated equally.- filter_peaksbool
If true, returns harmonic summation only on frequencies of peak magnitude. Otherwise returns harmonic summation over the full spectrum. Defaults to True.
- fill_valuefloat
The value to fill non-peaks in the output representation. (default: np.nan) Only used if
filter_peaks == True.- kindstr
Interpolation type for harmonic estimation. See
scipy.interpolate.interp1d.- axisint
The axis along which to compute harmonics
- Returns:
- S_salnp.ndarray
S_salwill have the same shape asS, and measure the overall harmonic energy at each frequency.
See also
Examples
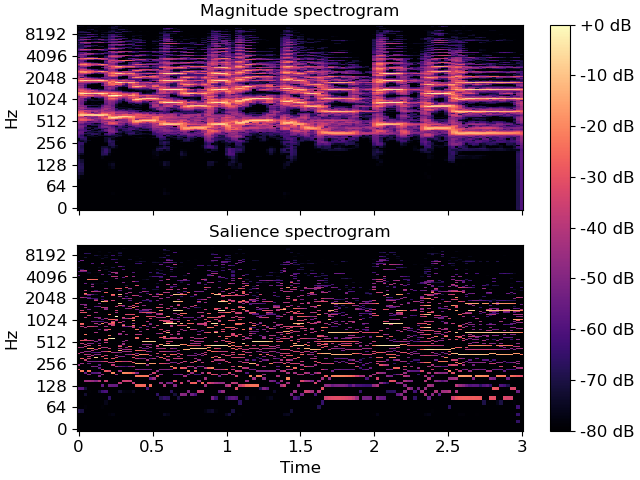
>>> y, sr = librosa.load(librosa.ex('trumpet'), duration=3)
>>> S = np.abs(librosa.stft(y))
>>> freqs = librosa.fft_frequencies(sr=sr)
>>> harms = [1, 2, 3, 4]
>>> weights = [1.0, 0.5, 0.33, 0.25]
>>> S_sal = librosa.salience(S, freqs=freqs, harmonics=harms, weights=weights, fill_value=0)
>>> print(S_sal.shape)
(1025, 115)
>>> import matplotlib.pyplot as plt
>>> fig, ax = plt.subplots(nrows=2, sharex=True, sharey=True)
>>> librosa.display.specshow(librosa.amplitude_to_db(S, ref=np.max),
...                          sr=sr, y_axis='log', x_axis='time', ax=ax[0])
>>> ax[0].set(title='Magnitude spectrogram')
>>> ax[0].label_outer()
>>> img = librosa.display.specshow(librosa.amplitude_to_db(S_sal,
...                                                        ref=np.max),
...                                sr=sr, y_axis='log', x_axis='time', ax=ax[1])
>>> ax[1].set(title='Salience spectrogram')
>>> fig.colorbar(img, ax=ax, format="%+2.0f dB")