Caution
You're reading the documentation for a development version. For the latest released version, please have a look at 0.11.0.
librosa.feature.hybrid_tempogram
- librosa.feature.hybrid_tempogram(*, y=None, sr=22050, onset_envelope=None, hop_length=512, win_length=384, center=True, window='hann', **kwargs)[source]
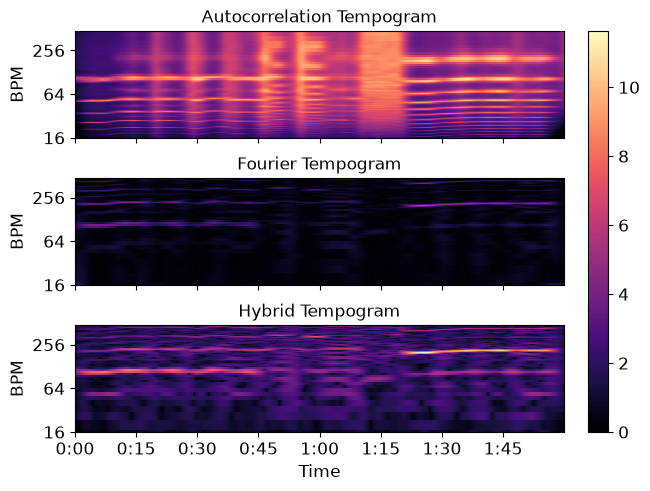
Compute a hybrid tempogram.
This function computes a hybrid representation by combining the Fourier tempogram and autocorrelation tempogram. The tempograms are aligned onto a common frequency grid and merged using the geometric mean [1].
[1]Peeters, Geoffroy. “Rhythm Classification Using Periodicities and the Beat-Histogram.” Proceedings of the 6th International Conference on Music Information Retrieval (ISMIR). 2005.
- Parameters:
- ynp.ndarray [shape=(…, n)] or None
Audio time series. Multi-channel is supported.
- srfloat > 0
Sampling rate
- onset_envelopenp.ndarray [shape=(…, n)] or None
Optional pre-computed onset strength envelope
- hop_lengthint > 0
Number of samples between frames
- win_lengthint > 0
Window length for analysis
- centerbool
Whether to center the frames
- windowstr, tuple, number, function, or np.ndarray [shape=(win_length,)]
A window specification as supported by
scipy.signal.get_windowandlibrosa.filters.get_window.- **kwargsadditional keyword arguments
Additional keyword arguments passed to
scipy.interpolate.interp1d
- Returns:
- hybridnp.ndarray
The hybrid tempogram combining both representations
See also
Examples
Compute local onset autocorrelation
>>> y, sr = librosa.loadx('nutcracker')
>>> hop_length = 512
>>> oenv = librosa.onset.onset_strength(y=y, sr=sr, hop_length=hop_length)
Compute the autocorrelation, Fourier, and hybrid tempograms
>>> tempogram = librosa.feature.tempogram(onset_envelope=oenv, sr=sr,
...                                       hop_length=hop_length)
>>> fourier_tempogram = librosa.feature.fourier_tempogram(onset_envelope=oenv, sr=sr,
...                                                       hop_length=hop_length)
>>> hybrid_tempogram = librosa.feature.hybrid_tempogram(onset_envelope=oenv, sr=sr,
...                                                     hop_length=hop_length)
Plot the results
>>> import matplotlib.pyplot as plt
>>> fig, ax = plt.subplots(nrows=3, sharex=True)
>>> librosa.display.specshow(tempogram, x_axis='time', y_axis='tempo',
...                          hop_length=hop_length, ax=ax[0])
>>> ax[0].set(title='Autocorrelation Tempogram')
>>> ax[0].label_outer()
>>> librosa.display.specshow(np.abs(fourier_tempogram), x_axis='time',
...                          y_axis='fourier_tempo', hop_length=hop_length, ax=ax[1])
>>> ax[1].set(title='Fourier Tempogram')
>>> ax[1].label_outer()
>>> img = librosa.display.specshow(hybrid_tempogram, x_axis='time',
...                                y_axis='fourier_tempo', hop_length=hop_length,
...                                ax=ax[2])
>>> ax[2].set(title='Hybrid Tempogram')
>>> fig.colorbar(img, ax=ax)