Caution
You're reading the documentation for a development version. For the latest released version, please have a look at 0.11.0.
librosa.sequence.viterbi_discriminative
- librosa.sequence.viterbi_discriminative(prob, transition, *, p_state=None, p_init=None, return_logp=False, transition_min_prob=None)[source]
Viterbi decoding from discriminative state predictions.
Given a sequence of conditional state predictions
prob[s, t], indicating the conditional likelihood of statesgiven the observation at timet, and a transition matrixtransition[i, j]which encodes the conditional probability of moving from stateito statej, the Viterbi algorithm computes the most likely sequence of states from the observations.This implementation uses the standard Viterbi decoding algorithm for observation likelihood sequences, under the assumption that
P[Obs(t) | State(t) = s]is proportional toP[State(t) = s | Obs(t)] / P[State(t) = s], where the denominator is the marginal probability of statesoccurring as given byp_state.Note that because the denominator
P[State(t) = s]is not explicitly calculated, the resulting probabilities (or log-probabilities) are not normalized. If using the return_logp=True option (see below), be aware that the “probabilities” may not sum to (and may exceed) 1.- Parameters:
- probnp.ndarray [shape=(…, n_states, n_steps), non-negative]
prob[s, t]is the probability of statesconditional on the observation at timet. Must be non-negative and sum to 1 along each column.- transitionnp.ndarray [shape=(n_states, n_states), non-negative]
transition[i, j]is the probability of a transition from i->j. Each row must sum to 1.- p_statenp.ndarray [shape=(n_states,)]
Optional: marginal probability distribution over states, must be non-negative and sum to 1. If not provided, a uniform distribution is assumed.
- p_initnp.ndarray [shape=(n_states,)]
Optional: initial state distribution. If not provided, it is assumed to be uniform.
- return_logpbool
If
True, return the log-likelihood of the state sequence.- transition_min_probfloat, >= 0
Optional: if provided, the minimum transition probability to consider during decoding.
- Returns:
- statesnp.ndarray [shape=(…, n_steps,)]
The most likely state sequence. If
probcontains multiple input channels, then each channel is decoded independently.- logpscalar [float] or np.ndarray
If
return_logp=True, the (unnormalized) log probability ofstatesgiven the observations.
See also
viterbiViterbi decoding from observation likelihoods
viterbi_binaryViterbi decoding for multi-label, conditional state likelihoods
Examples
This example constructs a simple, template-based discriminative chord estimator, using CENS chroma as input features.
Note
this chord model is not accurate enough to use in practice. It is only intended to demonstrate how to use discriminative Viterbi decoding.
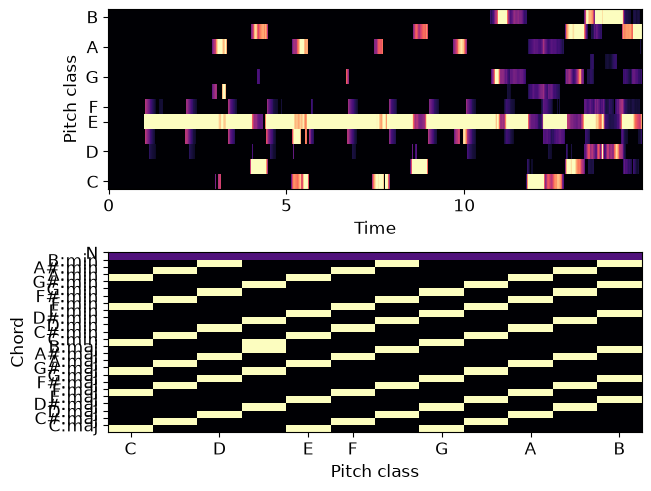
>>> # Create templates for major, minor, and no-chord qualities
>>> maj_template = np.array([1,0,0, 0,1,0, 0,1,0, 0,0,0])
>>> min_template = np.array([1,0,0, 1,0,0, 0,1,0, 0,0,0])
>>> N_template   = np.array([1,1,1, 1,1,1, 1,1,1, 1,1,1.]) / 4.
>>> # Generate the weighting matrix that maps chroma to labels
>>> weights = np.zeros((25, 12), dtype=float)
>>> labels = ['C:maj', 'C#:maj', 'D:maj', 'D#:maj', 'E:maj', 'F:maj',
...           'F#:maj', 'G:maj', 'G#:maj', 'A:maj', 'A#:maj', 'B:maj',
...           'C:min', 'C#:min', 'D:min', 'D#:min', 'E:min', 'F:min',
...           'F#:min', 'G:min', 'G#:min', 'A:min', 'A#:min', 'B:min',
...           'N']
>>> for c in range(12):
...     weights[c, :] = np.roll(maj_template, c) # c:maj
...     weights[c + 12, :] = np.roll(min_template, c)  # c:min
>>> weights[-1] = N_template  # the last row is the no-chord class
>>> # Make a self-loop transition matrix over 25 states
>>> trans = librosa.sequence.transition_loop(25, 0.9)
>>> # Load in audio and make features
>>> y, sr = librosa.loadx('nutcracker', duration=15)
>>> # Suppress percussive elements
>>> y = librosa.effects.harmonic(y, margin=4)
>>> chroma = librosa.feature.chroma_cqt(y=y, sr=sr, threshold=0.25)
>>> # Map chroma (observations) to class (state) likelihoods
>>> probs = np.exp(weights.dot(chroma))  # P[class | chroma] ~= exp(template' chroma)
>>> probs /= probs.sum(axis=0, keepdims=True)  # probabilities must sum to 1 in each column
>>> # Compute independent frame-wise estimates
>>> chords_ind = np.argmax(probs, axis=0)
>>> # And viterbi estimates
>>> chords_vit = librosa.sequence.viterbi_discriminative(probs, trans)
>>> # Plot the features and prediction map
>>> import matplotlib.pyplot as plt
>>> fig, ax = plt.subplots(nrows=2)
>>> librosa.display.specshow(chroma, x_axis='time', y_axis='chroma', ax=ax[0])
>>> librosa.display.specshow(weights, x_axis='chroma', ax=ax[1])
>>> ax[1].set(yticks=np.arange(25) + 0.5, yticklabels=labels, ylabel='Chord')
>>> plt.show()
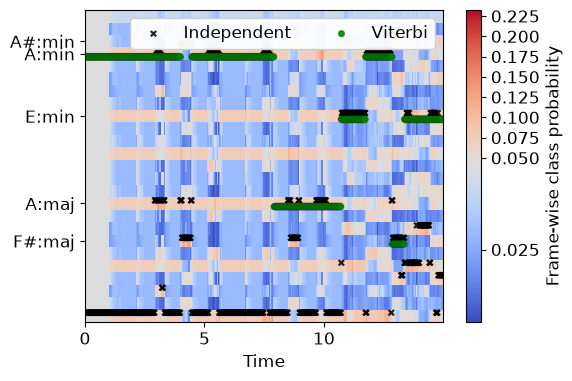
>>> # And plot the results
>>> fig, ax = plt.subplots()
>>> img = librosa.display.specshow(probs, x_axis='time', ax=ax, div_thresh=1./25)
>>> hl = librosa.display.highlight(ax=ax, alpha=0.1)
>>> fig.colorbar(img, ax=ax, label='Frame-wise class probability')
>>> times = librosa.times_like(chords_vit)
>>> ax.scatter(times, chords_ind + 0.25, alpha=0.85, marker='x', color='k',
...            s=15, label='Independent', path_effects=hl)
>>> ax.scatter(times, chords_vit - 0.25, alpha=0.85, marker='o', color='g',
...            s=15, label='Viterbi', path_effects=hl)
>>> ax.set(yticks=np.unique(chords_vit),
...        yticklabels=[labels[i] for i in np.unique(chords_vit)])
>>> ax.legend(loc='upper right', ncols=2)
>>> plt.show()