librosa.feature.chroma_vqt
- librosa.feature.chroma_vqt(*, y=None, sr=22050, V=None, hop_length=512, fmin=None, intervals, norm=inf, threshold=0.0, n_octaves=7, bins_per_octave=12, gamma=0)[source]
Variable-Q chromagram
This differs from CQT-based chroma by supporting non-equal temperament intervals.
Note: unlike CQT- and STFT-based chroma, VQT chroma does not aggregate energy from neighboring frequency bands. As a result, the number of chroma features produced is equal to the number of intervals used, or equivalently, the number of bins per octave in the underlying VQT representation.
- Parameters:
- ynp.ndarray [shape=(…, n,)]
audio time series. Multi-channel is supported.
- srnumber > 0
sampling rate of
y- Vnp.ndarray [shape=(…, d, t)] [Optional]
a pre-computed variable-Q spectrogram
- hop_lengthint > 0
number of samples between successive chroma frames
- fminfloat > 0
minimum frequency to analyze in the CQT. Default: C1 ~= 32.7 Hz
- intervalsstr or array of floats in [1, 2)
Either a string specification for an interval set, e.g., ‘equal’, ‘pythagorean’, ‘ji3’, etc. or an array of intervals expressed as numbers between 1 and 2. .. see also:: librosa.interval_frequencies
- normint > 0, +-np.inf, or None
Column-wise normalization of the chromagram.
- thresholdfloat
Pre-normalization energy threshold. Values below the threshold are discarded, resulting in a sparse chromagram.
- n_octavesint > 0
Number of octaves to analyze above
fmin- bins_per_octaveint > 0, optional
Number of bins per octave in the VQT.
- gammanumber > 0 [scalar]
Bandwidth offset for determining filter lengths. .. see also:: librosa.vqt
- Returns:
- chromagramnp.ndarray [shape=(…, bins_per_octave, t)]
The output chromagram
Examples
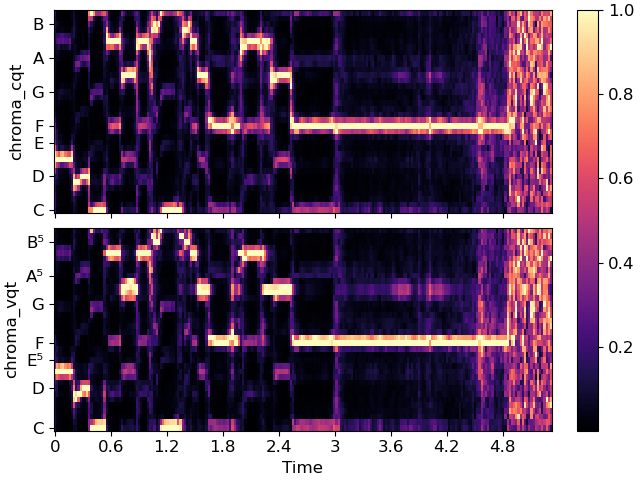
Compare an equal-temperament CQT chromagram to a 5-limit just intonation chromagram. Both use 36 bins per octave.
>>> y, sr = librosa.load(librosa.ex('trumpet'))
>>> n_bins = 36
>>> chroma_cq = librosa.feature.chroma_cqt(y=y, sr=sr, n_chroma=n_bins)
>>> chroma_vq = librosa.feature.chroma_vqt(y=y, sr=sr,
...                                        intervals='ji5',
...                                        bins_per_octave=n_bins)
>>> import matplotlib.pyplot as plt
>>> fig, ax = plt.subplots(nrows=2, sharex=True)
>>> librosa.display.specshow(chroma_cq, y_axis='chroma', x_axis='time',
...                          ax=ax[0], bins_per_octave=n_bins)
>>> ax[0].set(ylabel='chroma_cqt')
>>> ax[0].label_outer()
>>> img = librosa.display.specshow(chroma_vq, y_axis='chroma_fjs', x_axis='time',
...                                ax=ax[1], bins_per_octave=n_bins,
...                                intervals='ji5')
>>> ax[1].set(ylabel='chroma_vqt')
>>> fig.colorbar(img, ax=ax)