Caution
You're reading the documentation for a development version. For the latest released version, please have a look at 0.11.0.
librosa.display.colorbar_phase
- librosa.display.colorbar_phase(im, *, numticks=9, ax=None, fig=None, **kwargs)[source]
Attach a colorbar to an image representing phase data in radians.
The colorbar will display ticks at rational multiples of π.
- Parameters:
- immatplotlib.cm.ScalarMappable
The image to which the colorbar will be attached. Generally this will be a
matplotlib.image.AxesImageormatplotlib.collections.QuadMeshas returned byspecshow.- numticksint > 0
The number of ticks to display on the colorbar. Default is 9, corresponding to multiples of π/4.
- axmatplotlib.axes.Axes or None
The axes to which the colorbar will be attached. If None, the colorbar will be attached to the axes of im.
- figmatplotlib.figure.Figure, SubFigure, or None
The figure to which the colorbar will be attached. If None, the colorbar will be attached to the figure of im.
- **kwargs
Additional keyword arguments to pass to fig.colorbar.
- Returns:
- cbarmatplotlib.colorbar.Colorbar
The created colorbar object.
Examples
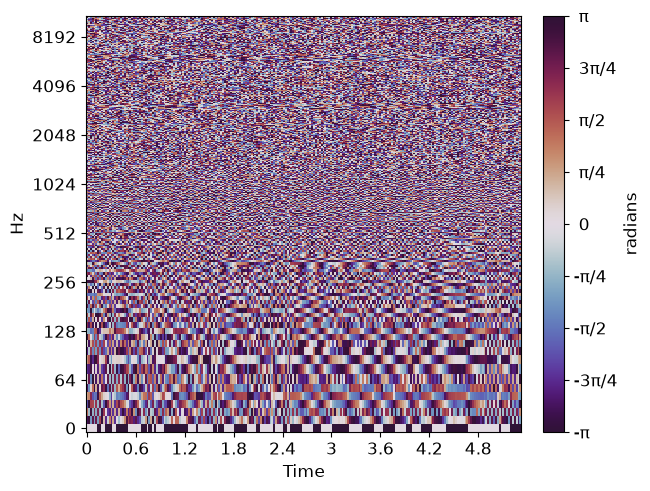
Attach a colorbar to a phase spectrogram
>>> import matplotlib.pyplot as plt
>>> import librosa
>>> y, sr = librosa.loadx('trumpet')
>>> S = librosa.stft(y)
>>> fig, ax = plt.subplots()
>>> im = librosa.display.specshow(S, ax=ax, y_axis='log', x_axis='time', vscale='phase')
>>> librosa.display.colorbar_phase(im)
>>> plt.show()
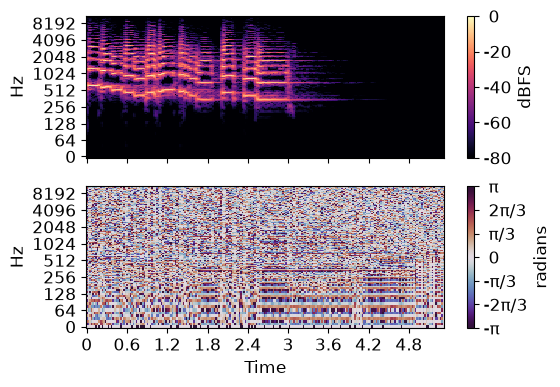
Attach a colorbar to one subplot axes, and show as multiples of π/3.
>>> fig, ax = plt.subplots(nrows=2, sharex=True, sharey=True)
>>> im_mag = librosa.display.specshow(S, ax=ax[0], y_axis='log', x_axis='time', vscale='dBFS')
>>> cbar = librosa.display.colorbar_db(im_mag, ax=ax[0], label='dBFS')
>>> im_ph = librosa.display.specshow(S, ax=ax[1], y_axis='log', x_axis='time', vscale='dphase')
>>> cbar = librosa.display.colorbar_phase(im_ph, ax=ax[1], numticks=7)
>>> ax[0].label_outer()
>>> plt.show()