Caution
You're reading the documentation for a development version. For the latest released version, please have a look at 0.11.0.
librosa.display.highlight
- librosa.display.highlight(*, artist=None, ax=None, color=None, bright_color='white', dark_color='black', luminance_threshold=0.5, **kwargs)[source]
Apply a contrasting highlight effect to a matplotlib artist.
This is primarily useful for providing contrast between an artist (e.g., a line plot) and an underlying image (e.g., a spectrogram or scatter plot). For example, if the underlying image is predominantly dark (under the choice of colormap), then a bright highlight (default “white”) should be used. If the underlying image is predominantly bright, then a dark highlight (default “black”) should be used.
This function is designed to automatically infer which kind of highlight should be applied based on the contents of the ax axes object, if any. If no color-mapped data can be identified on ax, then the axes facecolor or figure facecolor will be used as fallbacks.
If an artist is provided, the highlight effect will be applied in-place, but this is optional. (See examples below.)
The choices for bright and dark highlight colors, as well as the luminance threshold for determining which to use, can be customized via the bright_color, dark_color, and luminance_threshold parameters.
Alternatively, the user can bypass the automatic color inference and directly specify a highlight color via the color parameter.
- Parameters:
- artistmatplotlib.artist.Artist, optional
The artist to which the highlight effect should be applied. If not provided, the function will still return the appropriate path effect object(s) based on the contents of ax, but will not apply them to any artist.
- axmatplotlib.axes.Axes, optional
The axes to inspect for color-mapped data to determine the appropriate highlight color. If not provided, the function will attempt to infer an appropriate axes object from artist, and if that fails, will default to the current axes (plt.gca()).
- colorcolor specifier, optional
A color specification to use directly for the highlight, bypassing the automatic color inference. If not provided, the function will determine whether to use bright_color or dark_color based on the contents of ax and the luminance_threshold.
- bright_colorcolor specifier, default ‘white’
The color to use for the highlight if the underlying axes is determined to be dark.
- dark_colorcolor specifier, default ‘black’
The color to use for the highlight if the underlying axes is determined to be bright.
- luminance_thresholdfloat, default 0.5
The luminance threshold for determining whether the underlying axes is considered bright or dark. Luminance is calculated by converting the relevant color to YIQ color space and taking the Y (luminance) component. If the luminance is above this threshold, the axes is considered bright and dark_color will be used for the highlight. If the luminance is below this threshold, the axes is considered dark and bright_color will be used for the highlight.
- **kwargsdict
Additional keyword arguments to pass to
matplotlib.patheffects.withStrokewhen creating the highlight effect. Common options include linewidth (default to 2) and alpha (default to 1.0).Note
foreground, if provided, will override the color parameter and the automatic color inference. To avoid confusion, it’s recommended to specify highlight color via the color parameter and not to provide foreground in kwargs.
- Returns:
- effectslist of matplotlib.patheffects.AbstractPathEffect
A list of path effect objects that implement the highlight. If artist was provided, these effects will have been applied to the artist in-place. If artist was not provided, these effects can be applied to any artist via artist.set_path_effects(effects).
Examples
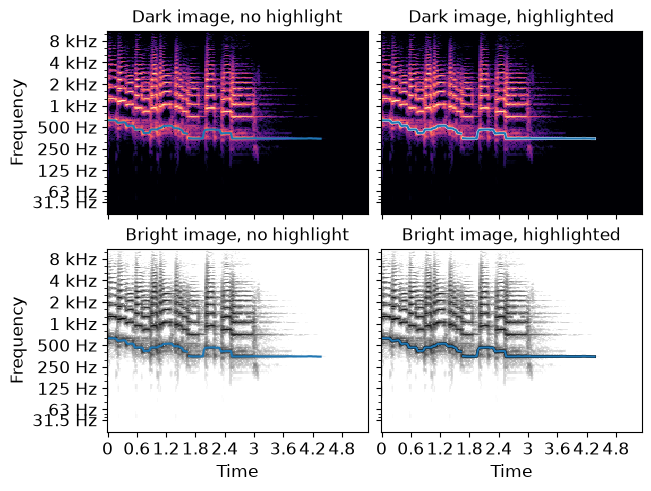
Plotting an f₀ contour with and without highlighting, in bright or dark colormaps
>>> import matplotlib.pyplot as plt
>>> y, sr = librosa.loadx('trumpet')
>>> f0, _, _ = librosa.pyin(y, fmin=100, fmax=1000)
>>> times = librosa.times_like(f0)
>>> D = librosa.stft(y)
>>> fig, ax = plt.subplots(nrows=2, ncols=2, sharex=True, sharey=True)
>>> librosa.display.specshow(D, x_axis='time', y_axis='log_oct3', ax=ax[0, 0],
...                          vscale='dBFS')
>>> ax[0, 0].plot(times, f0)
>>> ax[0, 0].set_title('Dark image, no highlight')
>>> librosa.display.specshow(D, x_axis='time', y_axis='log_oct3', ax=ax[0, 1],
...                          vscale='dBFS')
>>> line = ax[0, 1].plot(times, f0)[0]  # 'plot' returns a list of artists
>>> librosa.display.highlight(artist=line)
>>> ax[0, 1].set_title('Dark image, highlighted')
>>> librosa.display.specshow(D, x_axis='time', y_axis='log_oct3', ax=ax[1, 0],
...                          vscale='dBFS', cmap='gray_r')
>>> ax[1, 0].plot(times, f0)
>>> ax[1, 0].set_title('Bright image, no highlight')
>>> librosa.display.specshow(D, x_axis='time', y_axis='log_oct3', ax=ax[1, 1],
...                          vscale='dBFS', cmap='gray_r')
>>> # We can also construct the highlight first and then supply it to the plot command
>>> hl = librosa.display.highlight(ax=ax[1, 1])
>>> ax[1, 1].plot(times, f0, path_effects=hl)
>>> ax[1, 1].set_title('Bright image, highlighted')
>>> for a in ax.flat:
...     a.label_outer()
>>> plt.show()