Caution
You're reading the documentation for a development version. For the latest released version, please have a look at 0.11.0.
librosa.display.legend_for_axes
- librosa.display.legend_for_axes(axes=None, *, fig=None, **kwargs)[source]
Create a figure-level legend for a collection of axes.
This is similar to
matplotlib.figure.Figure.legend, but it limits the handle collection to only those belonging to the specified axes. This makes it easier to create different legends for subsets of a subplot array.- Parameters:
- axesmatplotlib.axes.Axes or array-like of Axes, optional
Axes to include in the legend aggregation. If not provided, axes are taken from fig.axes, or from the current figure if fig is not provided.
- figmatplotlib.figure.Figure, optional
Figure on which to create the legend. If not provided, it is inferred from axes, or from plt.gcf() if axes is also not provided.
- **kwargs
Additional keyword arguments passed to
matplotlib.figure.Figure.legend.
- Returns:
- legendmatplotlib.legend.Legend
The created legend.
Examples
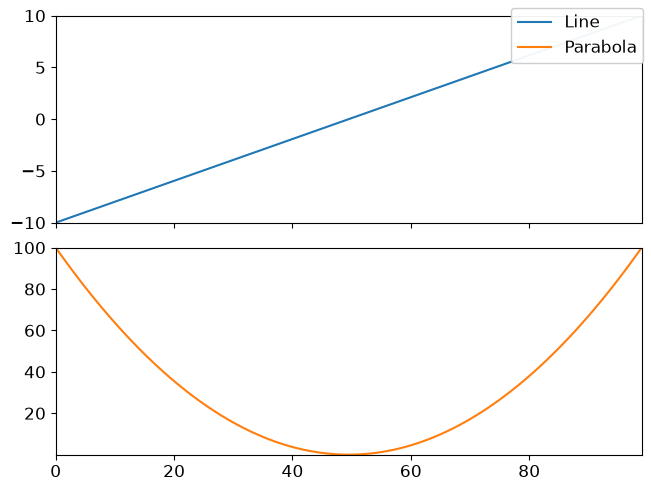
If no axes are provided, we aggregate legends across all subplots on the current figure:
>>> import matplotlib.pyplot as plt
>>> x = np.linspace(-10, 10, 100)
>>> fig, ax = plt.subplots(nrows=2, ncols=1, sharex=True)
>>> ax[0].plot(x, label='Line', color='C0')
>>> ax[1].plot(x**2, label='Parabola', color='C1')
>>> librosa.display.legend_for_axes()
>>> plt.show()
You can also specify a subset of axes to aggregate, and control the legend placement:
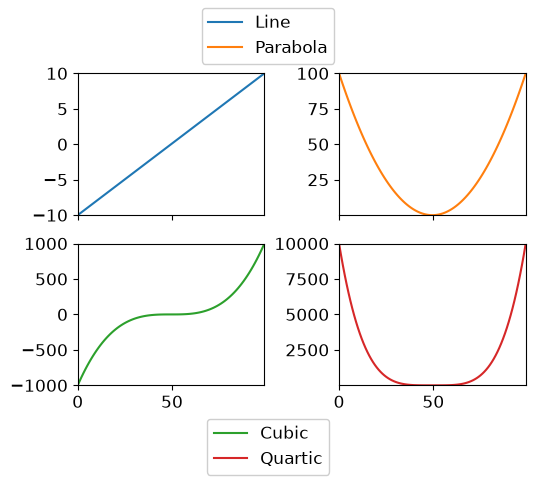
>>> fig, ax = plt.subplots(nrows=2, ncols=2, sharex=True)
>>> ax[0, 0].plot(x, label='Line', color='C0')
>>> ax[0, 1].plot(x**2, label='Parabola', color='C1')
>>> ax[1, 0].plot(x**3, label='Cubic', color='C2')
>>> ax[1, 1].plot(x**4, label='Quartic', color='C3')
>>> librosa.display.legend_for_axes(axes=ax[0], loc='outside upper center')
>>> librosa.display.legend_for_axes(axes=ax[1], loc='outside lower center')
>>> plt.show()