Caution
You're reading the documentation for a development version. For the latest released version, please have a look at 0.11.0.
librosa.display.multiplot
- librosa.display.multiplot(func, *data, axes=None, fig=None, orient='v', share_properties=None, fig_kw=None, sharex=True, sharey=True, label_outer=True, labels=None, titles=None, prop_cycle=None, **kwargs)[source]
Visualize multiple related waveforms or spectrograms on an array of subplots.
- Example use cases include:
Displaying multiple waveforms from a multi-channel audio file.
Displaying multiple spectrograms from a multi-channel audio file.
- Parameters:
- funcstr
The name of the display function to use for the multiplot. Accepted values are ‘waveshow’, ‘wavebars’, and ‘specshow’.
- *dataone or more `np.ndarray`s
The input data for the multiplot. If one array is provided, it is interpreted as a multi-channel array, where the leading dimensions correspond to different channels or signals to plot. If multiple arrays are provided, each array is treated as a single channel or input signal, and visualized on its own subplot.
- axesmatplotlib.axes.Axes, np.ndarray, or None
The axes to use for the multiplot. If None, a new axes array will be created on fig. If an array of Axes objects is provided, it must be compatible with the shape of the data. If a single axes object is provided, it will be interpreted as a 1x1 array (i.e. a single subplot).
- figmatplotlib.figure.FigureBase or None
The figure to use for the multiplot. If None, a new figure will be created if needed. If axes is provided, the figure will be inferred from axes and the fig parameter will be ignored.
- orientstr {‘h’, ‘v’}
The orientation of the multiplot grid. Accepted values are ‘h’ for horizontal and ‘v’ for vertical. This determines how the subplots are arranged when the input data has a single non-singleton dimension (e.g., shape (n, k) with k > 1).
- share_propertiesbool, str, np.ndarray, or None
The property sharing scheme for the multiplot grid. Accepted values are:
None or False: no properties are shared, and each subplot is treated as a unique group.
True: all subplots share the same properties and belong to a single group.
‘row’: subplots in the same row share properties and belong to the same group
‘col’: subplots in the same column share properties and belong to the same group.
np.ndarray: a custom array of group identifiers for each subplot. The shape of the array must match the shape of the axes grid. Any two elements with the same value are considered to be in the same group and will share properties.
- fig_kwdict or None
Additional keyword arguments to pass to
plt.subplotswhen creating a new figure.- sharexbool
Whether to share the x-axis among subplots when creating a new figure.
- shareybool
Whether to share the y-axis among subplots when creating a new figure.
- label_outerbool
Whether to only show labels on the outer axes when using shared axes.
- labelssequence of str or None
The labels to apply to each subplot in the multiplot grid. If None, no labels will be applied. If a sequence is provided, it must be compatible with the shape of the axes.
- titlessequence of str or None
The titles to apply to each subplot in the multiplot grid. If None, no titles will be applied. If a sequence is provided, it must be compatible with the shape of the axes.
- prop_cyclecycler.Cycler or None
The property cycle to use for assigning properties to the subplots. If None, the default property cycle from plt.rcParams[“axes.prop_cycle”] will be used.
- **kwargs
Additional keyword arguments to pass to the display function for each subplot.
- Returns:
- np.ndarray
An array of display objects returned by the display function for each subplot in the multiplot grid The shape of this array will be compatible with the shape of the axes grid.
See also
Examples
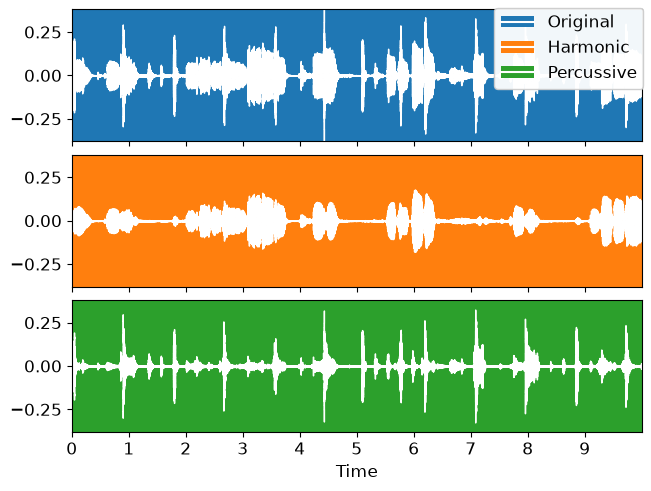
Display multiple synchronized signals stacked in an array. We’ll let multiplot create the figure and axes objects for us.
>>> import matplotlib.pyplot as plt
>>> y, sr = librosa.loadx('choice', duration=10)
>>> yh, yp = librosa.effects.hpss(y)
>>> librosa.display.multiplot('waveshow', y, yh, yp,
...                           labels=['Original', 'Harmonic', 'Percussive'],
...                           # The remaining parameters are passed through to waveshow
...                           sr=sr,
...                           invert=True)
>>> librosa.display.legend_for_axes()  # Helper to create a single legend across subplots
>>> plt.show()
Multiplot can also accept preconstructed axes as input, provided that they are compatible with the shape of the data. The below example does this with a spectrogram display.
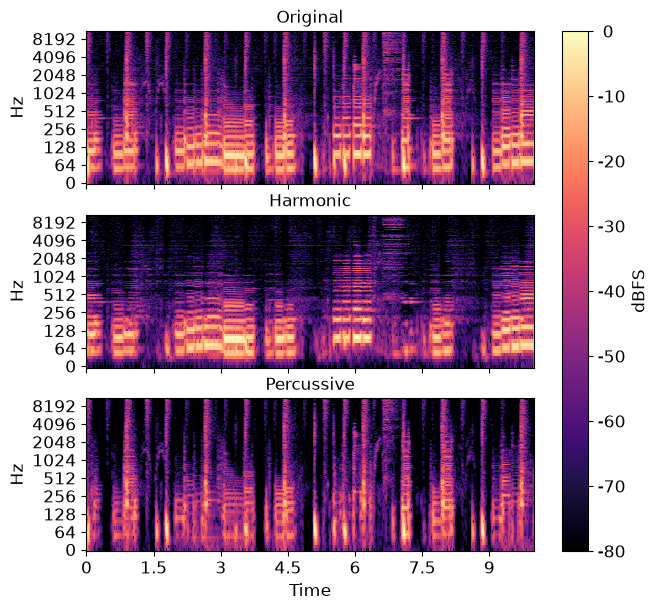
>>> y_stack = librosa.to_multi(y, yh, yp)
>>> stft = librosa.stft(y=y_stack)
>>> fig, ax = plt.subplots(nrows=3, sharex=True, sharey=True, figsize=(8, 8))
>>> img = librosa.display.multiplot('specshow', stft, axes=ax,
...                                 titles=['Original', 'Harmonic', 'Percussive'],
...                                 x_axis='time', y_axis='log', vscale='dBFS')
>>> librosa.display.colorbar_db(img[0], ax=ax, label='dBFS')
>>> plt.show()