

Note
Go to the end to download the full example code.
Superflux onsets#
This notebook demonstrates how to recover the Superflux onset detection algorithm of Boeck and Widmer, 2013 [1] from librosa.
This algorithm improves onset detection accuracy in the presence of vibrato.
# Code source: Brian McFee
# License: ISC
We’ll need numpy and matplotlib for this example
The method works fine for longer signals, but the results are harder to visualize.
y, sr = librosa.loadx("trumpet", sr=44100)
HTML(librosa.util.example_info("trumpet", html=True))
Audio(url=librosa.example("trumpet", url=True))
These parameters are taken directly from the paper
n_fft = 1024
hop_length = int(librosa.time_to_samples(1./200, sr=sr))
lag = 2
n_mels = 138
fmin = 27.5
fmax = 16000.
max_size = 3
The paper uses a log-frequency representation, but for simplicity, we’ll use a Mel spectrogram instead.
S = librosa.feature.melspectrogram(y=y, sr=sr, n_fft=n_fft,
                                   hop_length=hop_length,
                                   fmin=fmin,
                                   fmax=fmax,
                                   n_mels=n_mels)


fig, ax = plt.subplots()
librosa.display.specshow(S, vscale="dBFS[power]",
                         y_axis="mel", x_axis="time", sr=sr,
                         hop_length=hop_length, fmin=fmin, fmax=fmax, ax=ax)
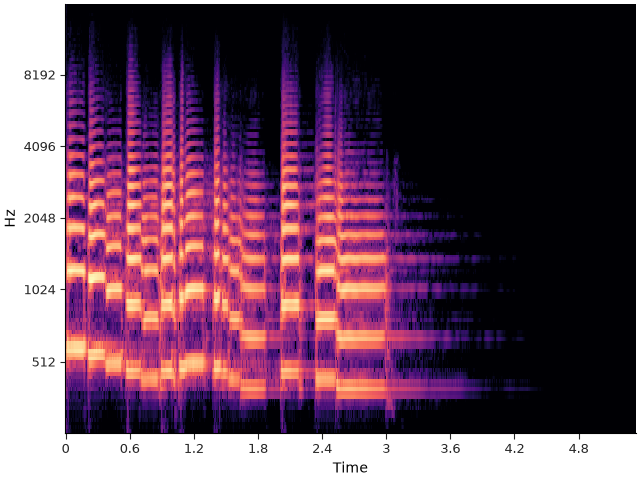
Now we’ll compute the onset strength envelope and onset events using the librosa defaults.
odf_default = librosa.onset.onset_strength(y=y, sr=sr, hop_length=hop_length)
onset_default = librosa.onset.onset_detect(y=y, sr=sr, hop_length=hop_length,
                                           units="time")
And similarly with the superflux method
odf_sf = librosa.onset.onset_strength(S=librosa.power_to_db(S, ref=np.max),
                                      sr=sr,
                                      hop_length=hop_length,
                                      lag=lag, max_size=max_size)

onset_sf = librosa.onset.onset_detect(onset_envelope=odf_sf,
                                      sr=sr,
                                      hop_length=hop_length,
                                      units="time")
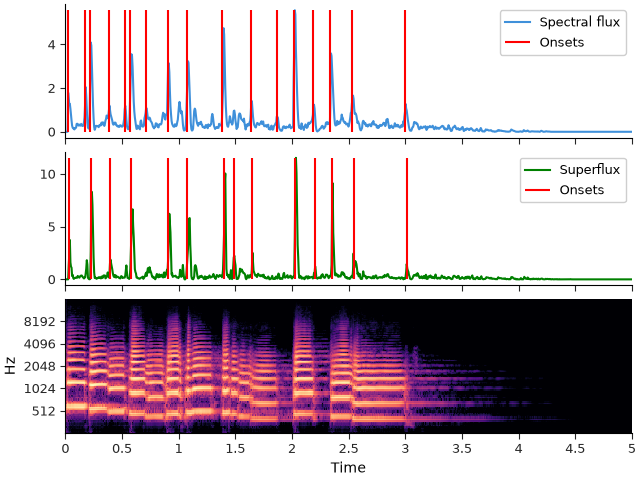
If you look carefully, the default onset detector (top sub-plot) has several false positives in high-vibrato regions, eg around 0.62s or 1.80s.
The superflux method (middle plot) is less susceptible to vibrato, and does not detect onset events at those points.
fig, ax = plt.subplots(nrows=3, sharex=True)

frame_time = librosa.frames_to_time(np.arange(len(odf_default)),
                                    sr=sr,
                                    hop_length=hop_length)

librosa.display.specshow(S, vscale="dBFS[power]",
                         y_axis="mel", x_axis="time", sr=sr,
                         hop_length=hop_length, fmin=fmin, fmax=fmax, ax=ax[2])
ax[2].set(xlim=[0, 5.0])


ax[0].plot(frame_time, odf_default, label="Spectral flux")
ax[0].vlines(onset_default, 0, odf_default.max(), color="r", label="Onsets")
ax[0].legend()
ax[0].label_outer()

ax[1].plot(frame_time, odf_sf, color="g", label="Superflux")
ax[1].vlines(onset_sf, 0, odf_sf.max(), color="r", label="Onsets")
ax[1].legend()
ax[0].label_outer()
Total running time of the script: (0 minutes 0.500 seconds)