librosa.segment.subsegment#
- librosa.segment.subsegment(data, frames, *, n_segments=4, axis=-1)[source]#
Sub-divide a segmentation by feature clustering.
Given a set of frame boundaries (
frames), and a data matrix (data), each successive interval defined byframesis partitioned inton_segmentsby constrained agglomerative clustering.Note
If an interval spans fewer than
n_segmentsframes, then each frame becomes a sub-segment.- Parameters:
- datanp.ndarray
Data matrix to use in clustering
- framesnp.ndarray [shape=(n_boundaries,)], dtype=int, non-negative]
Array of beat or segment boundaries, as provided by
librosa.beat.beat_track,librosa.onset.onset_detect, oragglomerative.- n_segmentsint > 0
Maximum number of frames to sub-divide each interval.
- axisint
Axis along which to apply the segmentation. By default, the last index (-1) is taken.
- Returns:
- boundariesnp.ndarray [shape=(n_subboundaries,)]
List of sub-divided segment boundaries
See also
agglomerativeTemporal segmentation
librosa.onset.onset_detectOnset detection
librosa.beat.beat_trackBeat tracking
Notes
This function caches at level 30.
Examples
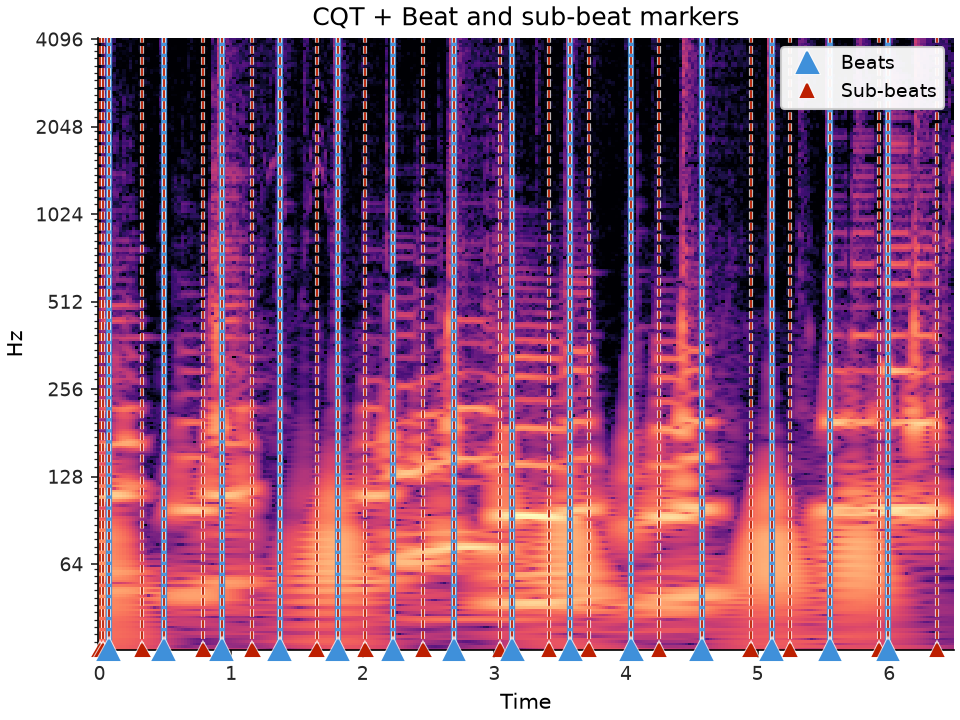
Load audio, detect beat frames, and subdivide in twos by CQT
>>> y, sr = librosa.loadx('choice', duration=6.5)
>>> tempo, beats = librosa.beat.beat_track(y=y, sr=sr, hop_length=512)
>>> beat_times = librosa.frames_to_time(beats, sr=sr, hop_length=512)
>>> cqt = np.abs(librosa.cqt(y, sr=sr, bins_per_octave=36, n_bins=36*7, hop_length=512))
>>> subseg = librosa.segment.subsegment(cqt, beats, n_segments=2)
>>> subseg_t = librosa.frames_to_time(subseg, sr=sr, hop_length=512)
>>> import matplotlib.pyplot as plt
>>> import matplotlib.transforms as mpt
>>> fig, ax = plt.subplots()
>>> librosa.display.specshow(cqt, vscale='dBFS', bins_per_octave=36,
...                          y_axis='cqt_hz', x_axis='time', ax=ax)
>>> hl = librosa.display.highlight(ax=ax, alpha=0.75, linewidth=2)
>>> trans = mpt.blended_transform_factory(
...             ax.transData, ax.transAxes)
>>> ax.plot(beat_times, np.zeros_like(beat_times), '^', zorder=4,
...         markerfacecolor='C0', color='C0', linestyle='', clip_on=False,
...         markersize=10, label='Beats', transform=trans, path_effects=hl)
>>> ax.vlines(beat_times, 0, 1, color='C0', linestyle='-', transform=trans,
...            linewidth=3, alpha=0.9, zorder=1.5, path_effects=hl)
>>> ax.plot(subseg_t, np.zeros_like(subseg_t), '^', zorder=3,
...         markerfacecolor='C2', color='C2', linestyle='', clip_on=False,
...         markersize=6, label='Sub-beats', transform=trans, path_effects=hl)
>>> ax.vlines(subseg_t, 0, 1, color='C2', linestyle='--', transform=trans,
...            linewidth=1, alpha=0.9, path_effects=hl)
>>> ax.legend(loc='upper right')
>>> ax.set(title='CQT + Beat and sub-beat markers')